1 Introduction, scope and approach
Layer four of the Assessment of Risk (AoR) is a forward looking, “Horizon Scan” at emerging risk, changing operational demand, and plausible future scenarios.
This document provides an assessment of how external drivers may impact risk and demand for LFB response up to 2030. This allows for longer term planning to be undertaken and for risk controls to be identified by risk owners in the early stages of risk development.
This assessment focuses on operational risks and how these may manifest in London. Where a wider focus has been used, it is to identify drivers of increasing likelihood or consequence of risks to which LFB may have to respond or will impact response. It comprises the outcomes of three strands of work:
(i) PESTLE analysis; used to identify drivers of changing likelihood or severity of risk and to provide broad subjective analysis of the operating environment and context up to 2030.
Drivers identified in this section are assessed for:
- change to LFBs operating environment
- impact on LFBs service delivery up to 2030
- evidence of early signals of existing impact.
(ii) Demand Trend Analysis and Demand Forecasting; using historical incident data to track trends in demand and to provide forecasting of possible future demand. This approach uses statistical forecasting tools, exceedance analysis and historical incident data analysis.
Analysis in this section focusses on changes to:
- type of demand (what is happening)
- pattern of demand (when is it happening and how much/often)
- demand as a capacity risk, “exceedance analysis.” (how likely are LFB to use lots of resources or to reach capacity for individual capabilities).
(iii) Forward-looking operational scenario modelling. Three types of scenarios have been developed:
- Probabilistic Scenarios– Where trends are modified to explore increasing or decreasing likelihood of certain outcomes in the future
- Deterministic Scenarios – Creating plausible extreme events, that have not yet happened, based on trends and PESTLE analysis
- Contingent Scenarios – Assuming the occurrence of a specific adverse condition, e.g. a deterioration in international conflict, to explore exposure.
Scenarios explore the implications of modelled outcomes for operational response under conditions of:
- Significant changes to demand
- Plausible extreme events and event combinations
- Significant adverse change in operating environment.
2 Objectives
The purpose of Layer four is to:
- Provide an understanding of the plausible future operating context up to 2030 to inform strategic decision making
- Identify risks where additional controls may be considered by risk owners within LFB’s prioritisation framework
- Inform choices about future resource planning, making LFB, “future fit”.
3 Limitations
The trends, forecasts and scenarios in this report are illustrative rather than exhaustive or predictive.
Trend analysis relies on drivers of demand remaining consistent for a period. It is not always possible to identify all drivers of demand or how these factors will change and interact. This means that trends identified in this report may change or reverse over time based on external factors. They should not be taken as a prediction.
The specific forecasting tools used in this report, ETS, ARIMA and SARIMAX uses historical incident volumes to project future demand. An ETS forecast assumes these patterns remain stable and does not account for external drivers. SARIMAX forecasting uses seasonal structures in incident data. It assumes consistent historical relationships and stable seasonality. ARIMA forecasting uses underlying trends in incident demand to project future volumes, assuming stable patterns, but cannot capture seasonality and loses accuracy when incident behaviour changes.
Because incident data is a lagging indicator it may underrepresent changing climate, demographic or geopolitical driven risk, even where historic averages appear stable. LFB incident data is characterised by a wide range between day-to-day activity, demand peaks and isolated high-consequence events. Very rare or very extreme events that do not appear in the data capture period may be underrepresented as risks but remain plausible. LFB has experienced multiple low-frequency high consequence events that were not linked to identified incident trends.
Scenarios presented represent credible variations of trends and plausible extreme events emerging from the PESTLE analysis and from incident data. Scenarios are intended to indicate possible magnitudes and scopes of outlier events and trend developments, rather than to provide a prediction or to indicate all potential outliers. There is inherent uncertainty associated with low-likelihood, high-impact events.
4 Key Findings
2030 Plausible Operating Environment. Based on the individual findings below, in 2030 LFB is plausibly operating in an environment characterised by three inter-related themes; changing baseload demand, increased volatility, and enduring chronic risk. These themes are not separate, they interact, shaping both day-to-day activity and exposure to extreme events. It is plausible for acute risks identified in this report, such as large complex-building fires and high volumes of people in crisis, to occur within the context of more chronic risks such as extreme heat, widespread flooding, or civil disturbances caused by social and political tensions. The concurrent nature of acute and high-impact incidents with chronic environmental or societal stressors, increases demand on response functions.
2030 Operating environment contingent on deterioration in international conflicts. Contingent on a deterioration in international conflicts and geopolitical instability; it is plausible that within the planning horizon of 2030, LFB may be required to support wider civil resilience and/or national resilience arrangements and Home Defense, in line with established frameworks such as the Civil Contingences Act and any relevant new legislation . Should these demands occur, they will occur alongside and interact with the impacts of climate, demographic and built environment change described in the plausible 2030 operating environment, not in isolation from them.
Individual Findings
- LFB has robust pumping appliance capacity. Projected increases in day-to-day demand to 2030 remain within existing pumping appliance capacity for modelled day-to-day demand, assuming current availability levels. However, short-duration extreme events, particularly large wildfires or concurrent incidents during heatwaves, could temporarily test capacity, particularly where incidents are sustained over multiple days.
- Day to day demand is changing. Day-to-day demand is shifting from predominantly fire-dominated to an increasing volume of special services, particularly incidents linked to physical and mental ill-health. Scenarios indicate sustained growth and significant projected volumes of these services. Incidents involving people in crisis could potentially exceed 8,000 per annum by 2030 and collapse-behind-locked-door incidents could potentially exceed 16,000. Fires are declining overall, however, fires in high-rise buildings and flats remain a persistent risk, associated with higher potential casualty rates and have not followed the downward trend seen in other fires.
- Demand Is seasonal. Both day-to-day demand and the frequency of high demand days increase between June and September. Peaks most often occur in July driven by fires outdoors and rainstorms. This effect is likely to become increasingly marked by 2030.
- Outlier days. Since 2022, the number of days above historical average mobilisation levels has increased. Increased volatility and more frequent high demand days are expected to continue. Recent outlier events have been preceded by red extreme-heat and amber wind warnings. This indicates actionable warning periods for wildfire and windstorms.
- Climate Change is an increasing seasonal threat with significant uncertainty about impact scale. There is a divergence between climate risk identified in PESTLE, from Met Office and Environment Agency analyses, and LFB incident data. Across both surface-water flooding and rural/vegetation fires, recorded incidents show high year-to-year variability with a seasonal peak, but no consistent trend upward or consistent increase in peak severity. However, climate projections indicate increasing frequency and intensity of heat and heavy rainfall hazards. Recorded incidents in this context should be taken as lagging indicators rather than indicative of future severity.
- Periods of extreme heat are forecast to become more extreme and more common. Risks, such as wildfires, drought, piped water supply failures (referenced on national and local risk registers), large structural fires, and public disorder have a seasonal pattern with more demand in the summer. Combinations of these and similar events are plausibly magnified by extreme heat. Extreme heat also imposes physiological load on LFB staff concurrent with demanding incidents.
- An increasingly complex built environment. Rapid adoption of new fuels, technologies and construction methods plausibly outpaces regulatory change and assurance. This creates long-term exposure to system failures and to novel fire behaviors in complex premises, tall buildings and the wider built environment.
- There is increasing potential for fire service incidents resulting from, or concurrent with, malicious acts. Acts linked to, or inspired by, international events and geopolitical tensions may result in demand for fire service capabilities. These threats include terrorism, civil unrest, cyberattacks, and acts by malicious state and non-state actors as reflected in national and London risk registers.
5 PESTLE Analysis
PESTLE analysis has been carried out by the LFB Risk team with reference to the sources listed in appendix 1, to subject matter engagement, and professional judgement. This analysis provides an understanding of the external drivers impacting LFB’s operational service delivery to 2030 and informs both demand forecasting and scenario development, presented later in this document.
PESTLE Category
- Political
Driver / Context
- Geopolitical Tension and Security Threats
Impact on LFBs service delivery up to 2030
- Potential for fire service incidents linked to, or inspired by, international events and community tensions. Increasingly complex and volatile threat picture. Increase in incidents relating to terrorism, civil unrest, cyberattacks, and malicious state and non-state actors.
Early signals of change identified in current operating environment:
- Increased operational activity within LFB in response to incidents involving foreign state activity on UK interests.
PESTLE Category
-
Economic
Driver / Context
- Increasing poverty and financial stress for communities in London.
Impact on LFBs service delivery up to 2030
- Increasing deprivation puts upwards pressure on demand for LFB Services. Increase in day-to-day demand. Marked Increase in special services linked to social vulnerability.
Early signals of change identified in current operating environment:
- Upward trend in incident numbers driven by special service incidents.
- LFB and national incident data broadly link demand for services with levels of deprivation.
PESTLE Category
-
Social
Driver / Context
- Demographic change and increased population density.
Concentrated vulnerability. *Due to aging population and increasing deprivation
Increasingly poor mental and physical health of population
Impact on LFBs service delivery up to 2030
- Increased demand for welfare-type responses (PIC, health-related rescues e.g. bariatric rescue) and multiagency working in welfare context.
Combined medical and rescue context, e.g. bariatric rescues during firefighting operations, increase complexity of rescues and evacuations.
Early signals of change identified in current operating environment:
- Upward trend in overall incident numbers.
- Upward trend in special service incidents.
- Upward trend in Person-in-Crisis (PIC) incidents.
- Upward trend in bariatric and ambulance-assist incidents.
- Upward trend in collapse behind locked door incidents.
PESTLE Category
-
Technological
Driver / Context
- Infrastructure fragility and vulnerability to malicious actors
New fuels and technologies introducing novel or residual response risk after regulation, e.g. autonomous vehicles
Impact on LFBs service delivery up to 2030
- Possible disruption to internal response-critical systems e.g. mobilising and call taking.
Possible disruption to external response- critical systems such as power and water supply and communications.
Possible development of new risks related to new technologies with regulatory lag * See legal risk
Early signals of change identified in current operating environment:
- Evidence of increasing cyber-attacks.
- Evidence of state actors undertaking below threshold malicious acts.
PESTLE Category
-
Legal
Driver / Context
- Innovation in the built environment and in new fuels and technologies plausibly outpaces regulatory updates.
Impact on LFBs service delivery up to 2030
- Regulatory lag results in a balance of controls where LFB holds residual, primarily response risk. LFB must mitigate legislative and regulatory risk through response, prevention, or protection of controls that are potentially insufficient.
Early signals of change identified in current operating environment:
- Rate of High-Rise fires does not follow downward trend of A1 fires.
- Increasing number of lithium-battery involved fires.
- 949 high-rise buildings with simultaneous evacuation strategies (02-03-2026).
- Sources show insurers pricing up for multi-occupancy/high‐rise. This pattern indicates that insurers expect elevated and persistent high-rise fire-loss potential.
PESTLE Category
-
Environmental
Driver / Context
- Climate change induced increases in extreme weather.
*Heat, Drought, Rural–Urban Interface wildfires, surface water flooding, fluvial floods, subsidence and heat effects to health.
Impact on LFBs service delivery up to 2030
- Flooding and storms
Increase in operational demand (likelihood and severity) from flooding and storm related incidents.
Wildfire Ignition at the rural –urban interface, spreading to building stock becomes increasingly likely.
Concurrent occurrence at multi-sites becomes more likely.
Extreme Heat Prolonged periods of extreme heat, exacerbated by heat island effect, impose physiological demands on staff and act as multiplier of severity and likelihood of other incident types.
The likelihood of operating in partially flooded urban environments increases.
Early signals of change identified in current operating environment:
- Demand analysis indicates an increasing number of outlier days and high demand days.
- Demand shows strong link to weather events.
- Extreme Outliers have occurred on three occasions since 2016 linked to hot weather and storms. No occurrences of similar magnitude events in the previous 10 years.
6 Demand Trend Analysis and Demand Forecasting
Type of demand (what is happening)
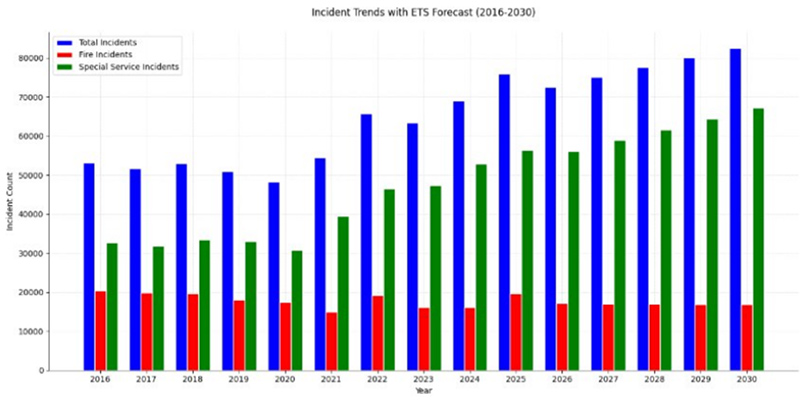
There is an upward trend in incident numbers. However, demand growth is not evenly distributed. Trend analysis and forecasting indicate a changed emphasis in demand profile by 2030. However, it should be noted that 2025 showed a slight year-on-year increase in fires and it is not clear if this is a minor fluctuation to a stable trend or a change in direction. Chart 1. shows trends in numbers of fire and non-fire incidents, “special services,” over time along with an ETS forecast of both to 2030:
- Total incidents are forecast to continue rising, reaching around 80,000 per annum by 2030 excluding false alarms (increase of around 10,000)
- Special Service incidents are the primary driver of growth, estimated to in the region of 65,000 per annum by 2030
- Fires are projected to gradually decline, dropping to around 15,000 per annum by 2030.
Chart 1. Incident trends; Fire and Special Services ETS forecast to 2030
Pattern of Demand (When is it happening and how much)
Demand for LFB services is rising, with increases in variation. Daily incident totals show a stronger summer peak, and since 2022 the frequency of days with demand above the historical average has increased. These days are predominantly associated with extreme heat, and with storms. This is consistent with broader climate-risk signals identified in the PESTLE analysis.
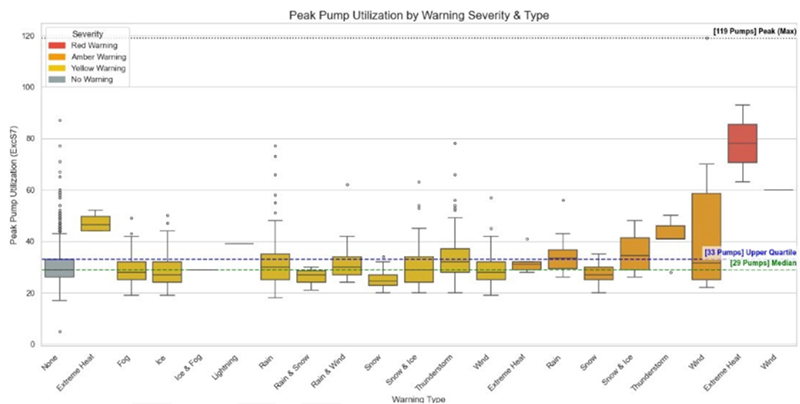
There are observable indicators of higher demand. Red extreme-heat warnings are associated with substantial increases in incident volumes, primarily fires outside. Amber wind warnings indicate elevated call volumes, related to items in precarious positions. The potential upper range of demand under these conditions, particularly for red extreme-heat remains uncertain as there are limited data points to draw on.
Seasonal and weather warning-linked demand reduce the likelihood of entirely unexpected surges. However, convective storms and surface-water flooding remain less predictable, with rapid onset and high volatility in demand and increasing background risk. Chart 2 shows trends in numbers of daily mobilisations over time with outlier demand highlighted in red. Chart 3 shows peak concurrent utilisation of pumping appliances mapped to the presence of Meteorological Office weather warnings.
Chart 2. Trends and outliers in daily mobilisations 2020-2025
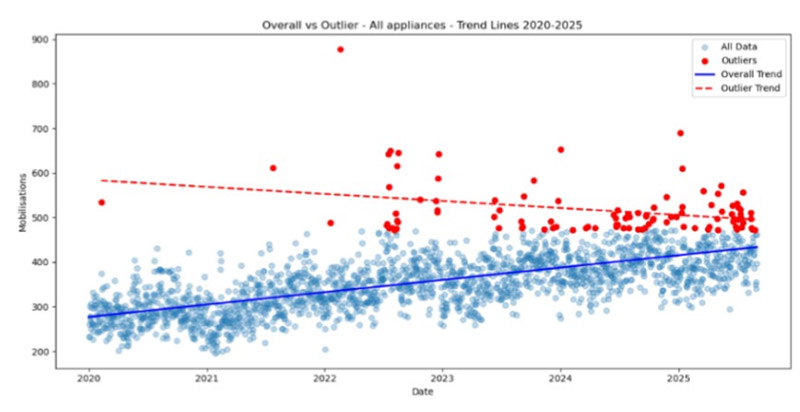
Chart 3. Utilisation of pumping appliances under weather warning conditions.
Demand as a capacity risk, “Exceedance Analysis,” (how likely are LFB to use lots of resource or to run out)
LFB’s combined pumping appliance fleet of 142 pumping appliances, and its deployment, acts as a frontline control measure for several risks:
- The risk of not being able to service normal day-to-day demand
- The risk of not being able to respond quickly enough to geographically dispersed risks
- The risk of insufficient capacity to respond to outlier demand and extreme events.
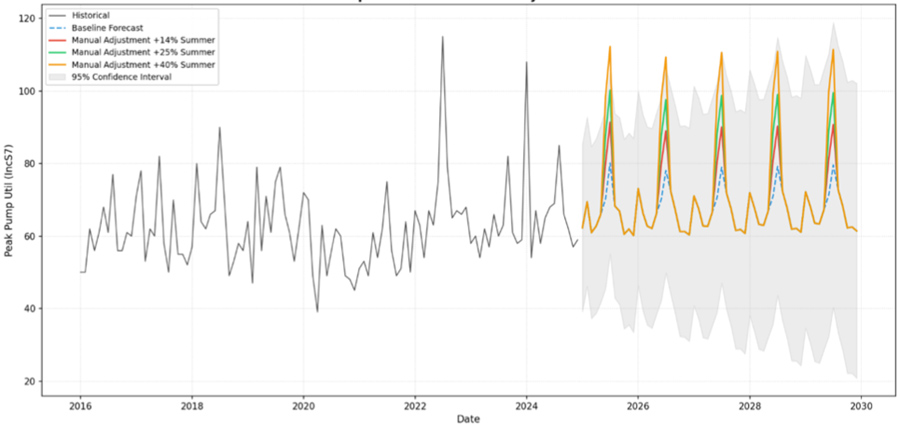
Maximum concurrent utilization of pumping appliances is an indicator of how much capacity is required to service demand and to control these risks. Historical data indicate that peak concurrent mobilisations rarely exceed 90 pumping appliances. However, exceedances have occurred in 2022 and in 2024 associated with hot weather and with storms. The chart below shows historical peaks in demand in black and a forecast in blue, for demand to 2030. The chart also includes an adjusted forecast in red, based on a plausible 14, 25 and 40% uplift in summer demand. This assessment represents pan-London utilisation. It does not capture localised surges, prolonged spate conditions at lower thresholds or complex multi-hazard concurrent events. However, the data indicates that LFB’s pumping appliance fleet is resilient to peaks and outliers in concurrent demand under historical and modelled conditions up to a 14% uplift in seasonal demand with greater uncertainty with uplifts of 25% and 40%. It should be noted that background climate hazard may be increasing faster than measured incident data and there is high level of uncertainty around the upper bounds of demand under climate-change conditions.
Peak Pump Utilization: Base vs Adjacent Forecasts
Fire Severity
There is a long-term downward trend in incidence of fire. This is not proportionally reflected in reduced fire fatalities or injuries. Fire-related fatalities in London fluctuate within a relatively narrow band, typically around 40–45 per year, with no clear downward trend.
Because fire fatalities are low-frequency events, annual totals are sensitive to random variation and single high-impact incidents. Non-fatal fire injuries demonstrate a gradual decline, but the rate of reduction is significantly shallower than the fall in total fires. Removing the extreme outlier of the Grenfell Tower Fire from the data set – because this event leads to the appearance of a steep decline in fire deaths - and using the remaining data to forecast, retains a wide spread of annual values and high variation year to year. Consequently, future annual fatality totals are likely to fluctuate within the observed historical range. This forward projection has high uncertainty due to low event counts and sensitivity to single incidents.
GT Adjusted dataset ETS forecast to 2030
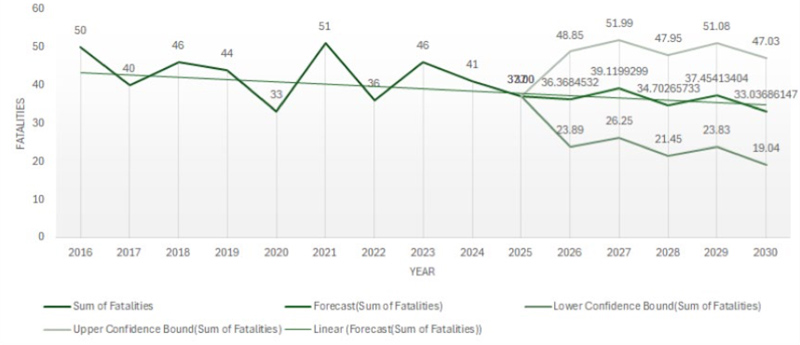
Fire Fatalities and Injuries
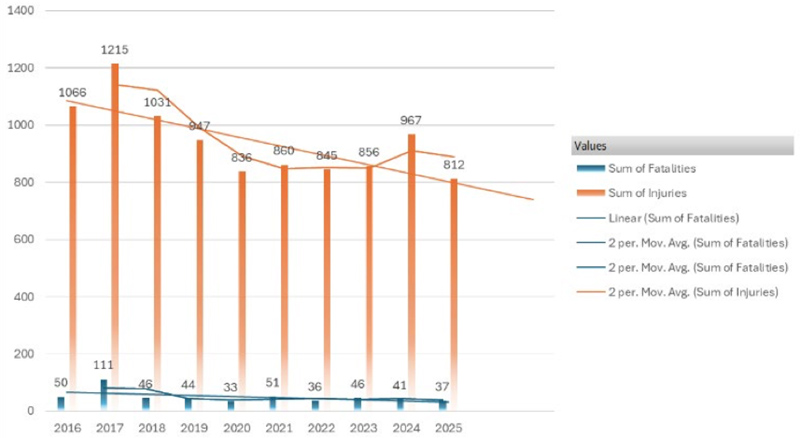
The divergence between trends in fires, injuries and fatalities suggests that while the reduction in fire incidents has been substantial, it does not always translate into proportional reductions in harm. The presence of single-incident high-harm, events in the unaltered data set indicates that these types of events remain plausible in the future despite the overall downward trend in fires.
Increasing dominance of Special Services
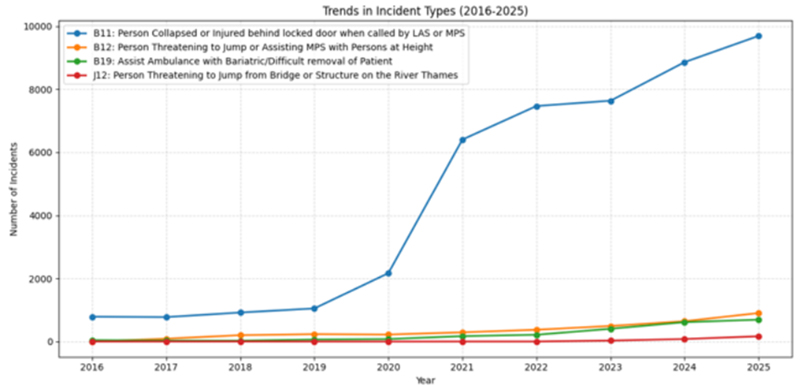
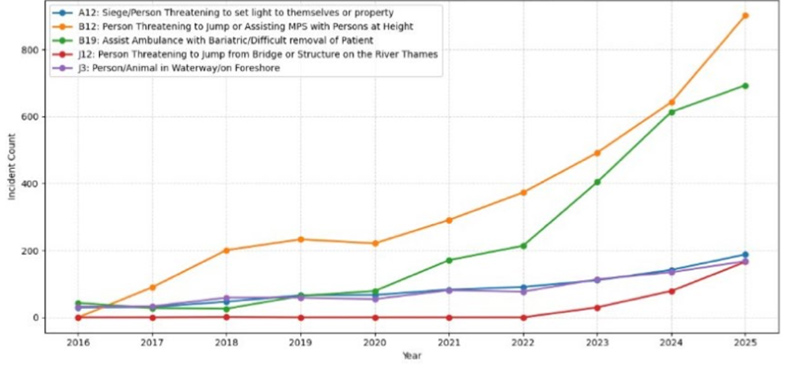
There is a marked rise in special service incidents. This rise is driven primarily by a growing cluster of incidents related to public health and wellbeing, such as:
- Person collapsed behind locked doors
- Person threatening to jump or to set light to self or property.
- Assistance to ambulance/bariatric rescue.
Although these incident types comprise a small number of incidents relative to the total attended by LFB, the rate of increase is marked.
Trends in incident Types (2016 - 2025)
Incident Type Trends over time (2016 - 2025) - Excluding B11
Special Appliance Exceedance Risk. (How likely are LFB to reach capacity of limited or specialist capabilities under normal and peak demand)
Special Appliances (Fire Rescue Units, Command Units and Aerial Appliances) provide several capabilities that are not available on pumping appliances. Risks that these appliances control are among those increasing most quickly in the observed incident data, e.g. B12, Person threatening to jump. The graphs below explore current levels of utilisation to understand the risk of demand exceeding capacity.
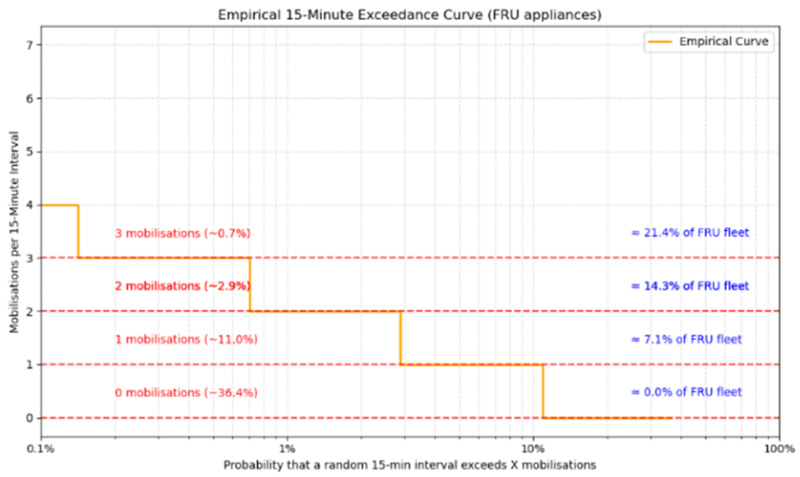
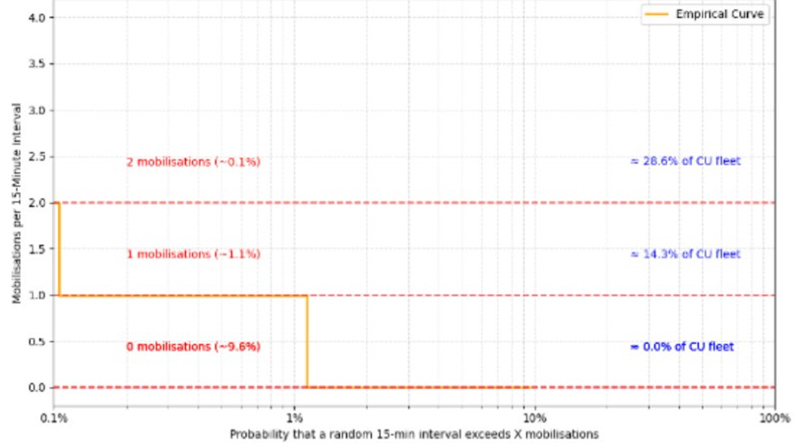
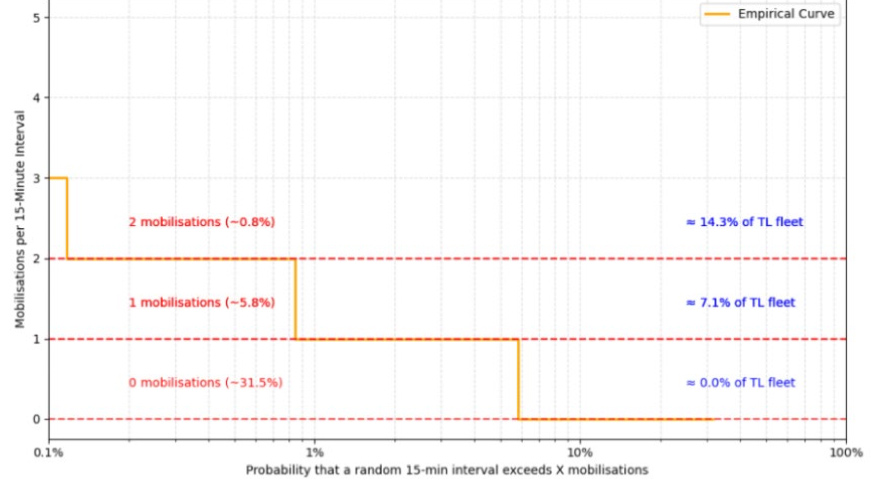
These graphs show how often different levels of simultaneous special appliance mobilisations occur within 15-minute intervals. Data has been used from 2023, 2024 and January – October 2025. This allows the probability of different levels of concurrent usage of Special Appliances to be assessed, helping to understand how the impact of the rise in special services impacts response.
The x-axis represents the probability that a random 15-minute period exceeds a given number of mobilisations, while the y-axis shows the number of appliances mobilised in those intervals.
The orange line is the exceedance curve, with red annotations marking key probability thresholds and blue labels indicating what proportion of the fleet that level represents
Fire Rescue Units (FRU) (used at incidents requiring technical rescue, hazardous material response, extended duration breathing apparatus and others)
This chart shows how often simultaneous FRU mobilisations occur within 15-minute intervals. 36% of intervals have at least one mobilisation, meaning that in roughly two-thirds of the time (64%) no FRUs are mobilised. Around 11% of intervals exceed one mobilisation, 3% exceed two, and less than 1% exceed three, indicating that multiple FRU mobilisations within the same 15-minute period are rare. This indicates that despite the increase in incidents requiring specialist skill sets, such as B12 person threatening to jump, the risk of being unable to deploy an FRU is low.
Empirical 15-minute exceedance curve (FRU appliances)
Command Units (CU) (used at incidents requiring intermediate Command Support)
This graph shows CU mobilisations occurring within 15-minute intervals. Approximately 9.6% of intervals have at least one mobilisation, meaning that approximately 90% of intervals have no mobilisations. Roughly 1.1% of intervals exceed one mobilisation, and fewer than 0.1% exceed two. Multiple CU mobilisations in the same 15-minute window are very rare.
Empirical 15-minute exceedance curve (CU appliances)
Aerial Appliances (used for incidents requiring high or extended reach)
This graph shows Aerial appliance mobilisations occurring within 15-minute intervals. Roughly 31.5% of intervals include at least one mobilisation, 68.5% of intervals, aerials are not mobilised. Around 5.8% of intervals exceed one mobilisation, and only 0.8% exceed two, approximately 14% of the TL fleet.
Empirical 15-minute exceedance curve (TL appliances)
7 Plausible Scenarios: 2030 Horizon
Three types of scenarios have been developed:
- Probabilistic Scenarios– Where trends are modified to explore increasing or decreasing likelihood of certain outcomes in the future
- Deterministic Scenarios – Creating plausible extreme events that do not appear in the data but are plausible based on trends and PESTLE analysis
- A Contingent Scenario– Assuming the occurrence of a specific adverse condition, in this case a deterioration in international conflict, to explore exposure.
The following scenarios are illustrative rather than exhaustive. They represent credible variations of trends and plausible extreme events emerging from the PESTLE analysis and from incident data. They are intended to indicate possible magnitudes and scopes of outlier events and developments, rather than to provide a prediction. There is inherent uncertainty associated with low-likelihood, high-impact events, and scenarios. The interaction of social, demographic, economic, and other factors that lead to emergencies occurring is complex. The scenarios presented draw on a small number of these factors to explore plausible directions in trends.
Probabilistic Scenario Model 1: Climate Impacts on Fire
Scenario:
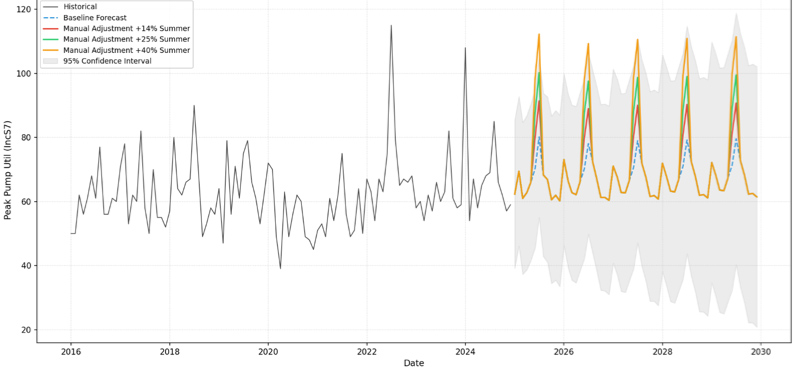
- 14%, 25% and 40% Increase in Summer demand by 2030 (SIRIMAX forecast +% uplift)
Key drivers:
- 14% Projected global increase in wildfires by 2030 due to climate change. *UNEP Spreading like Wildfire: The Rising Threat of Extraordinary Landscape Fires.
LFB evidence:
- Increasing trend in Fires in Rural land and Fires in vegetation. (48% increase since 2016 *LFB incident data)
LFB exposure:
- Seasonal demand peaks in May - August become more pronounced.
- Higher confidence band of baseline forecast approaches 85% pumping appliance capacity at peak.
- Model suggests that incidents of magnitude similar to and exceeding previous wildfire events are plausible.
- Geographic exposures is focused on areas of rural urban interface.
Peak pump utilisation: Base vs Adjusted Forecasts:
Key Insights:
- 2030 position indicates pronounced seasonal peaks
- Trend is forecast to follow seasonal pattern with slight increase in demand rather than sharp upward or downward trend
- There is wide range of uncertainty at the upper and lower ends. Forecast may be optimistic if climate change drivers become more intense.
Probabilistic Scenario Model 2. Increasing Mental Ill-Health
Scenario:
- Mental ill-health incidents increase at 95% confidence bound of Arima forecast.
Key external drivers
- 39% increase in mental health service access. Potential for unmet demand leads to increased incidences of crises.*NHS England data
LFB evidence:
- Substantial Increase in mental health incidents involving harm or threat of harm to self. *LFB Incident data
LFB exposure:
- Capacity exposure is minimal at fleet level. Exposures at specialist level are marked. TAR, SERT and to a lesser extent FRU.
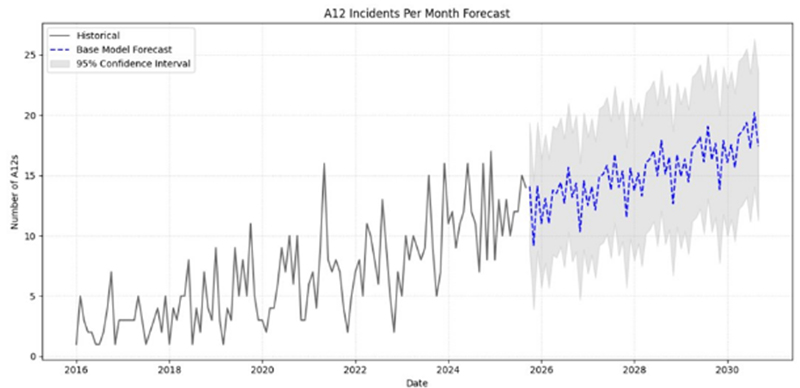
A12 (siege and Person Threatening to set light to self or property)
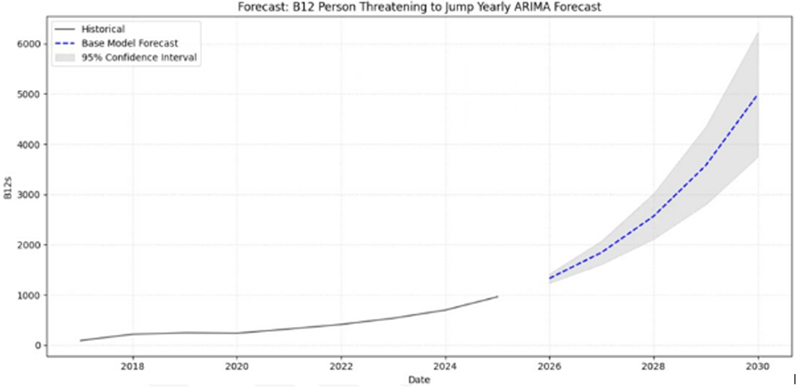
B12 (Person Threatening to Jump)
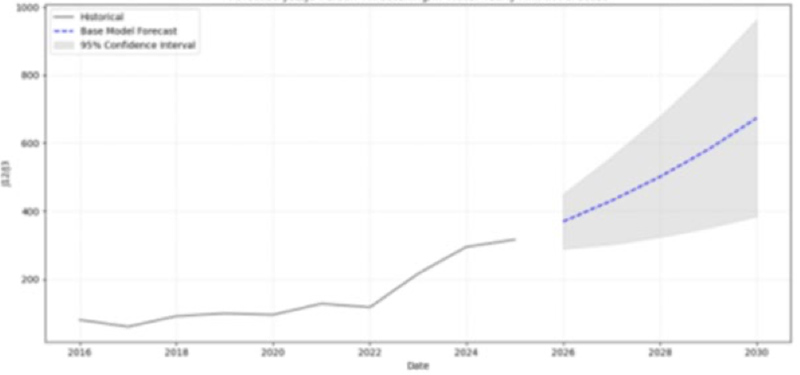
J12 and J3 (person threatening to jump into Thames or person in water)
Key Insights:
- Potential 2030 position of >6000 B12 incidents per year
- Potential 2030 position of >950 J12 and J3 Incidents per year
- Potential 2030 position of >300 A12 Incidents per year
Probabilistic Scenario Model 3. Aging population
Scenario:
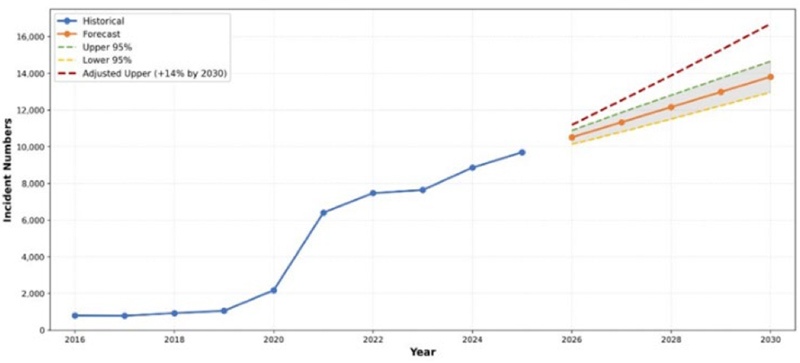
- Collapse-behind-locked-door (B11) increases at 95% confidence bounds of ETS forecast + 14%
Key drivers:
- Collapse-behind-locked-door (B11) increases at 95% confidence bounds of ETS forecast + 14%
LFB evidence:
- LFB B11 incident data trends.
LFB exposure:
- Pumping appliance capacity and availability.
Model with historical trends:
Probabilistic Scenario Models - Aging Population
B11: Person collapsed or injured behind locked door - ETS forecast (2016 - 2030)
Focus on modelled periods 2026 0230:
Probabilistic Scenario Models: Aging Population
B11: Person collapsed or injured behind locked door - ETS forecast (2026 - 2030)
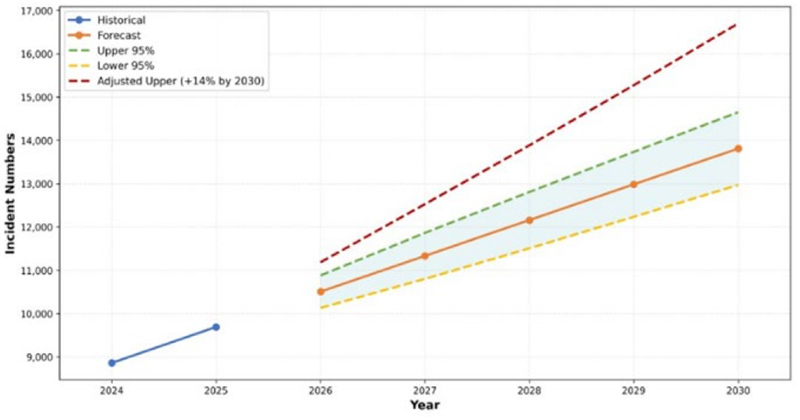
Key Insight:
- Potential demand in region of 16,500 incidents per year (increase in region of 7000 incidents).
Deterministic Scenario Model 1. Concurrent Ignition at Rural Urban Interface.
Scenario:
- Rural urban interface ignition at multi sites.
- Base model of 18th July 2022 (conservative) + 3 x 15 pump fires at RUI areas of previous fires.
Key driver:
- Met office/climate change modelling.
LFB evidence:
- 2022 40°C heat and RUI ignition at Wennington.
- 2018 multiple large grass/heath fires including100-hectare fire at Wanstead Flats.
LFB exposure:
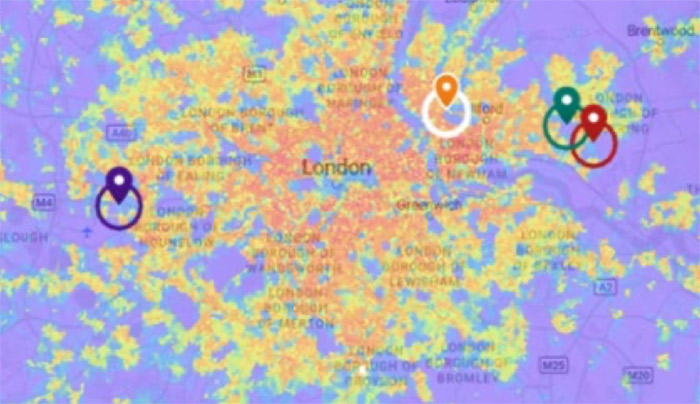
- London has approximately 47% greenspace including; Hampstead, Wanstead and Epping fringe. LFB has exposure to ignition in areas of rural urban interface
Base model of 18th July 2022 (conservative):
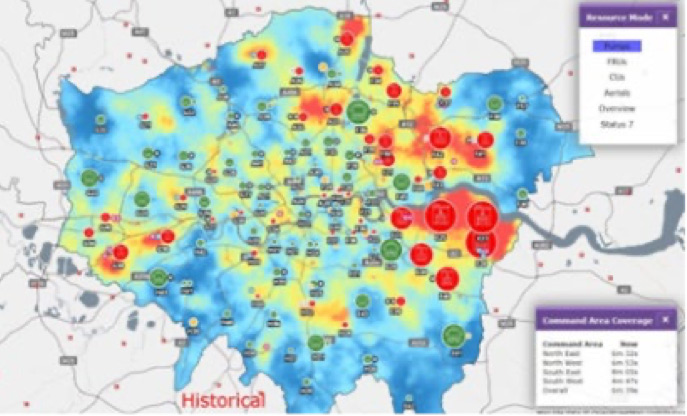
Primary locations of previous fire activity at RUI, key exposure locations.
Scenario = Base model plus 3 x15 pump fire at RUI key exposure locations.
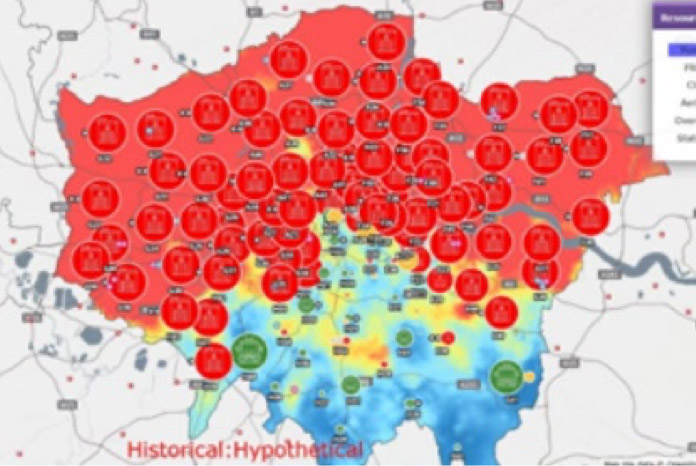
Key Insights:
- Utilization close to capacity driven by ignition at the RUI in outer London.
- The overall impact is similar to experience on July 19th 2022.
- High utilisation at the RUI reduces the ability to respond with speed and weight to central risks where property and people risks are highest.
- 13/16 arrangements are likely to limited by regional context of heat and wildfire.
Contingent scenario: Escalation of international tensions
Scenario:
- Escalation of international tensions where harmful sub-threshold activity (cyber, espionage etc.) transitions to include open conflict including a direct attack by a foreign nation on the UK.
Key driver (why plausible):
- National Security Risk Assessment (NSRA).
- R96
- R20a
- R20b
- R21a
- R21b
- R22a
- R22b
- R23a
- R23b
- R5b
- R9
LFB evidence (indications)
- Increased operational activity within LFB in response to incidents involving foreign state activity on UK soil.
LFB exposure (where/what):
- Disruption to critical fuel and energy locations.
- Disruption to major data centres and exchanges.
- Disruption to 999/Control and mobilising.
- Increase in demand - including a request for civilian aid to military authority (CAMA).
- Impact on water and wastewater treatment sites.
- Loss of communications.
- Increased risk of harm to emergency services while responding to targeted sites.
- Increase in maritime risk
Key Insight:
- Should these demands occur, they will occur alongside and interact with the impacts of climate, demographic and built environment changes described in the plausible 2030 operating environment, not in isolation from them.
Back to detailed report - all layers