1 Introduction
This layer identifies the risks that Londoners are most concerned about in relation to fire and rescue related emergencies. These concerns will not necessarily reflect the likelihood or severity of actual incidents but will reflect the concerns held by members of the public.
The purpose of this layer is to:
- Establish the primary concerns of the public as they relate to the fire service using communities lived experience to inform hazard identification
- Inform risk communication
- Allow public concerns to be considered when setting organisational risk priorities.
Hazard Identification
Members of the public may experience risks in their lives at a point earlier in the development of that risk than when it becomes visible in LFB incident data. This is because incident data is inherently backwards looking, measuring the impacts of risks once they have been realised. Members of the public can therefore provide intelligence about threats that they feel or experience day to day, enhancing LFBs understanding of the changing operating environment as it is experienced by the people living in it.
Risk Communication
By understanding the primary concerns of members of the public, and the way in which different hazards are perceived, the Brigade can make choices about targeting and prioritisation of risk communication work. This may include providing accessible information regarding risks about which there is a high level of public concern and targeted public education regarding hazards around which public concern is mismatched with the measured or assessed risk.
Prioritisation
Understanding which risks are perceived as most threatening to the public allows these concerns to be considered and weighed against others when setting organisational priorities, particularly with reference to discretionary or non-statutory work.
Through greater understanding of public concerns, the Brigade aims to strengthen the relationship between emergency responders and the communities served. The development of a greater shared understanding of hazards in the community informs both professional and public understanding of risk.
2 Approach
Acknowledging the limited reach of face-to-face engagement and the difficulty in providing full representation for a diverse city, LFB assesses public risk perception in three distinct ways to maximise understanding. These are:
- targeted community workshops, in person and online
- analysis of LFB website traffic to safety information pages
- YouGov polling.
This three-mode approach provides breadth and depth to the assessment with polling and website traffic having a wider reach than community workshops, and community workshops allowing risk to be explored in more depth.
3 Limitations
LFB acknowledge the limited reach of face-to-face community engagement. There is a fundamental constraint on the ability to scale face-to-face engagement to representative level. To provide a broader understanding; polling and website traffic analysis has been used.
LFB use website engagement as a proxy or indicator of public risk perception. We do not know the extent to which the public may seek safety information from other, unmeasured sources in preference to LFB safety information. This may skew our results. Data on LFB safety page traffic indicates an overall decline in user traffic from 2024 to 2025.
YouGov polling is intended to operate at a scale that is representative for London as a whole, however by presenting a pre-determined list of risks we acknowledge we are directing responses to areas of LFB concern. These risks may not reflect wider concerns of communities that are distinct from Fire Service operations.
Persistently high public concern regarding crime may lead to under measuring of other safety themes more specific to LFB if respondents and participants wish to use LFB engagement to highlight their primary crime focussed concerns.
4 Key Findings
Risk: Crime
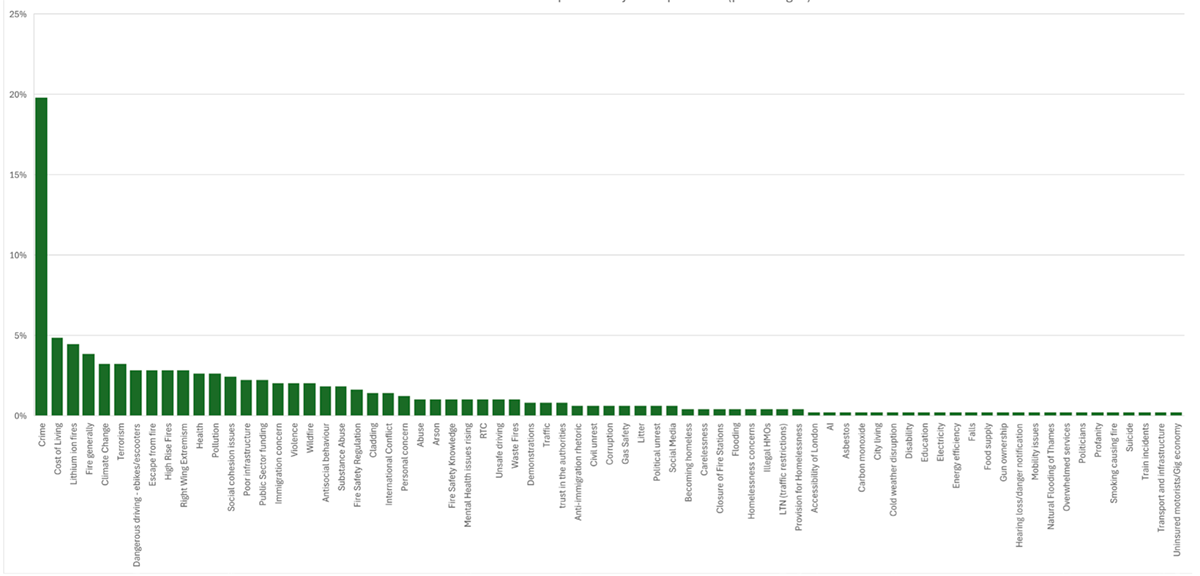
- Key finding: Workshop participants and YouGov respondents expressed consistently high levels of concern about crime, including knife crime, attacks, theft, burglary and drug activity. Notably, in September 2025 YouGov polling, crime was rated as being of equal or greater concern than any of the pre‑defined risks set by LFB.
- Implication: Because concern regarding crime may exceed concern regarding threats such as fire this may be impacting public engagement with fire and rescue safety messaging.
Risk: Fires in flats and shared living
- Key finding: Fires in flats and shared living is perceived by participants to be the most concerning risk of those presented on average in the workshops and in YouGov polling for 2026.
- Implication: Fires in purpose-built-flats are the highest risk property fire type in the measured data for 2026. This indicates public perception of risk reflects measured risk at a pan-London level, although not necessarily individual/personal risk.
Risk: Malicious threats and terrorism
- Key finding: Malicious attacks and terrorism consistently rank as a high‑concern risk, appearing as the second highest perceived threat in LFB workshops. However, it also shows the greatest variation between groups, indicating uneven levels of concern across communities. In YouGov polling, malicious threats and terrorism ranked fifth in September 2025 and third across all data sets since 2024 combined. This threat has persistent but varied and fluctuating prominence in public perception.
- Implication: Different communities may require targeted communication and/or engagement regarding malicious threats. The persistence of this threat amongst higher public concerns indicates that the public will expect activity from LFB in this area, but interest will fluctuate.
Risk: Water rescue
- Key finding: Water rescue consistently appeared as the lowest perceived threat in both community workshops and YouGov polling, a finding further supported by comparably lower traffic on LFB’s ‘Water Safety’ webpage. This low perception of risk contrasts with the high casualty and fatality rates associated with water incidents in London.
- Implication: The consistent gap between perceived and measured water‑related risk indicates that, although non-statutory, water safety may be a suitable target for risk communication and engagement.
Risks: Flooding and wildfires
- Key Finding: Although both flooding and wildfires are considered as concerning risks in other sections of this report, they are perceived as low‑threat by community workshop participants and YouGov respondents. Flooding information also attracts relatively little engagement on the LFB safety information webpages, sitting in the bottom 25% website traffic in 2025. Wildfire‑related pages show a rising trend in usage from a relatively low base.
- Implication: The gap between perceived and assessed risk for flooding and wildfire indicates that where the assessed background threat is rising, driven by climate change, but individual exposure and personal experience remain low, the public perceive the threat to be limited. This finding has implications for risk communication and public preparedness work, particularly related to Flooding - which remains non-statutory for LFB.
5 Workshop Findings
Participants in community workshops were invited to assess and share their perceptions of threats across a range of risk categories identified by LFB. In addition to assessing pre‑determined risk categories, participants were asked an open‑ended question regarding any additional risks/hazards of concern. Analysis was conducted on the structured questions (0–100 perceived threat) and free text responses.
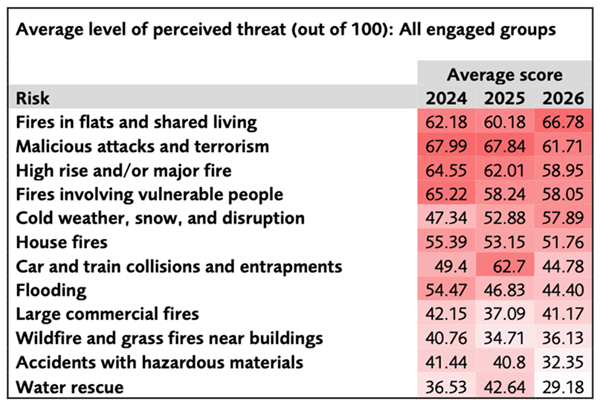
The risks perceived as most concerning by participants were fires in flats and shared living, malicious attacks and terrorism, high‑rise and/or major fire, and fires involving vulnerable people. This pattern is broadly consistent with findings from the previous two years, though some variation in the ranking of these risks is evident (info-graphic 1). Water rescue remained the lowest perceived threat and reduced to its lowest point in 2026. Accidents involving hazardous materials and wildfires/grassfires are also perceived to be relatively low risk by participants. This perceived risk is lower than the assessed risk of these incident types particularly with reference to reasonable-worst-case scenario assessments. It may be inferred that limited lived experience or direct exposure to these incident types contributes to their lower perceived risk.
Workshops indicate that risk perception is closely influenced by lived experience and local environmental context. Community workshops were conducted with targeted groups, and responses reflect individual context: (appendix n).
- Delivery riders and disabled advocacy groups rated “Cold weather, snow and disruption” as their highest‑perceived threat, likely reflecting the occupational and mobility challenges posed by severe weather conditions
- Central London borough workshops identified “Malicious attacks and terrorism” as most significant, consistent with proximity to government sites and major tourist destinations, as well as historical exposure to such incidents
- Boroughs with previous experience of notable cladding‑related fires, rated “Fires in flats and shared living” and “High‑rise and/or major fire” as the most significant risks.
Although malicious attacks and terrorism polled as one of the highest perceived threats overall, it showed the lowest level of cross-group agreement, which reinforces the finding that risk perception is strongly shaped by personal experience, environmental context, and differing levels of exposure to specific types of incidents. Conversely, high‑rise and/or major fire, saw one of the higher levels of agreement, suggesting that this risk is most concerning across wider population groups.
Several recurring themes were noted in free text responses submitted by participants, summarised in Table 2. The themes of public realm and transport safety, building safety, standards and maintenance, open flames, smoking and fireworks, Crime, anti‑social behaviour and deliberate hostile acts are consistent with reported concerns from 2025 indicating a level of persistent threat/concern. New themes in 2026 that did not appear in the 2025 results are summarised below:
- Risks affecting people with specific health or cognitive needs, such as challenges accessing 999 services for those with learning difficulties
- The practicality and safety of evacuation procedures, particularly for people with disabilities. This includes uncertainty around ‘stay put’ policies and the ability to evacuate safely during emergencies (e.g. use of lifts)
- A perceived need for improved fire safety education, clearer public messaging, and greater transparency - such as sharing fire investigation findings more widely
- A concern regarding response delays, power‑outage preparedness, and limitations on fire engine access. Participants linked these perceived concerns to wider concerns regarding public services
- Concerns about the sale of unsafe electrical goods, flammable materials (including children’s clothing), and ignition sources like sparklers indoors. These concerns may be amplified by media reporting and high‑profile incidents.
Infographic 1: Average concern levels for specified threats in each community workshop series
Infographic 2. Free text responses returned in community workshops -aggregated into themes.
|
Concern |
Summary Description |
Frequency of submission |
|
Public realm & transport safety |
Distracted pedestrians; unsafe road crossing; drivers and cyclists; unsafe driving; e-bikes and scooters; overcrowded public spaces; pavement safety and falls; poorly maintained public spaces; road congestion blocking emergency services; unsafe public transport (trains); bus fires. |
High |
|
Building safety, standards & maintenance |
Unsafe building modifications; unsafe housing conditions; high-rise buildings without second staircases; temporary accommodation safety; fire safety in flats; fire safety measures in buildings; unequal fire safety standards (tenants vs leaseholders); cladding; fire safety assessments by private companies. |
High |
|
Open flames, smoking & fireworks |
Smoking indoors; smoking related fire and health risks; cigarette disposal risks; candle fire risks; fireworks safety; unsafe behaviours in shared housing (BBQs and balconies). |
High |
|
Crime, anti‑social behaviour & deliberate hostile acts |
Theft; knife crime; anti-social behaviour; arson; digital scams; violent public disorder; social instability and disruption; hostile or deliberate acts. |
High |
|
Lithium‑ion batteries & charging |
Charging lithium batteries indoors; lithium battery charging and fire risks. |
Medium |
|
Health, vulnerability & safeguarding |
Mental-health related fire risk; suicide risk in public places; safeguarding at community events; hoarding and safeguarding barriers; post-incident community trauma; difficulty accessing 999 services for those with learning difficulties. |
Medium |
|
Accessibility & evacuation |
The practicality and safety of evacuation procedures, particularly for people with disabilities; uncertainty around ‘stay put’ policies; the ability to evacuate safely during emergencies (e.g. lifts); security features blocking exits (grills). |
Medium |
|
Information, communication & education |
Lack of battery-risk awareness; unsafe behaviours by neighbours; who to contact regarding concerns; fire safety education; misinformation regarding mobility batteries; lack of transparency regarding fire investigations. |
Medium |
|
Environmental & infrastructure hazards |
Vehicle air pollution; wildfire/grassfire; flooding; internal property flooding; surface water flooding; basement flooding. |
Medium |
|
Emergency response capacity & access |
Power outage preparedness; fire engine access limitations; lack of PPE for personal use; response delays due to public sector cuts; response delays. |
Low |
|
Electrical, materials & ignition safety |
Overuse of extension leads; faulty appliances; flammability of clothing; sparklers use indoors; poor quality electricals on sale. |
Low |
|
Egress, clutter & hoarding |
Hoarding and overcrowding; blocked escape routes and exits; unsafe behaviours in shared housing. |
Low |
6 Polling Findings
A series of polls were taken using the YouGov platform, sampling public concern regarding risk in March and September of 2024 and 2025. Polling provides a wider sample of respondents than achieved in community workshops and is conducted at a scale intended to be representative of London. Approximately 1,040 responses were collected in each poll. Respondents were asked the following question:
“Thinking about potential risks within your local community (e.g. fires, adverse weather conditions, natural events etc.) which ONE, if any, of the following are you MOST concerned about within your local community?”.
Respondents were presented with a prepopulated list of 12 specified risks, as well as the options of “don’t know,” “none of these,” and a free text option.
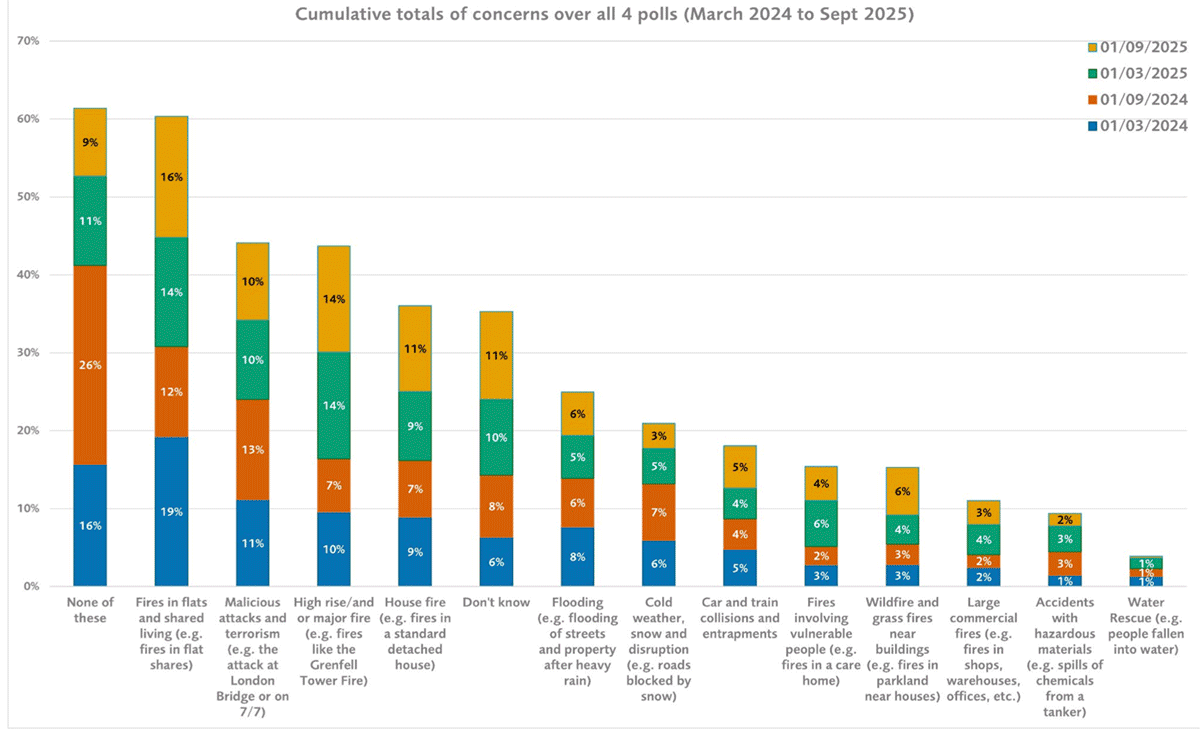
The top 6 concerns selected from the pre-defined incident-type categories were as follows:
- Fires in flats and shared living
- High rise/and or major fire
- ‘Don’t know’
- House fire (e.g. fires in a standard detached house).
- Malicious attacks and terrorism
- ‘None of these’
The top six concerns remained consistent across four separate polls since 2024, with slight variations in ranking, indicating a stable pattern of concern over time. Levels of concern reflect the housing stock in London, with flats, maisonettes, and apartments being London’s dominant accommodation type.(‘London’s housing stock 2024’ report). This indicates that concern may be driven by personal exposure, as respondents are likely to live in these types of housing.
‘Water rescue’, as with previous years’ analysis, remains consistently the least concerning risk to those polled by YouGov.
The option ‘None of these’ received the highest proportion of responses when all polls were aggregated. Infographic 3 shows that when asked to clarify with a free text response ‘Crime’ (including knife crime, attacks, theft, burglary and drugs) is the leading concern at around 20% of submissions, with all others at 5% or less. Compared to the initial poll results, this suggests people may be equally—or even slightly more—concerned about crime than about more fire service focussed risks.
Infographic 3: September 2025 YouGov respondents – Concerns (grouped) submitted via Free text field
Infographic 4: All YouGov poll results 2024 and 2025
7 Website Traffic Analysis
User traffic to individual LFB safety information pages is used to indicate levels of public interest and concern regarding specific risks. An assumption was made that a higher proportion of users viewing particular risk information indicated a higher level of public concern regarding that topic. Data was collected on individual users, rather than total views. Traffic was also analysed by meteorological season to identify trends. Note: Winter: Start Dec – end Feb; Spring: start Mar – end May; Summer: start June – end Aug; Autumn: start Sep – end Nov.
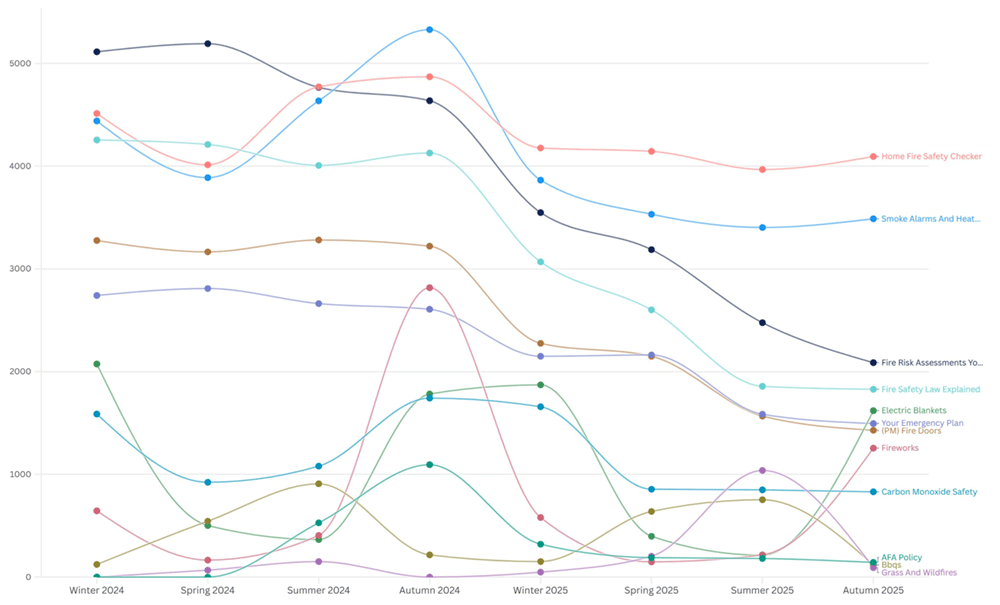
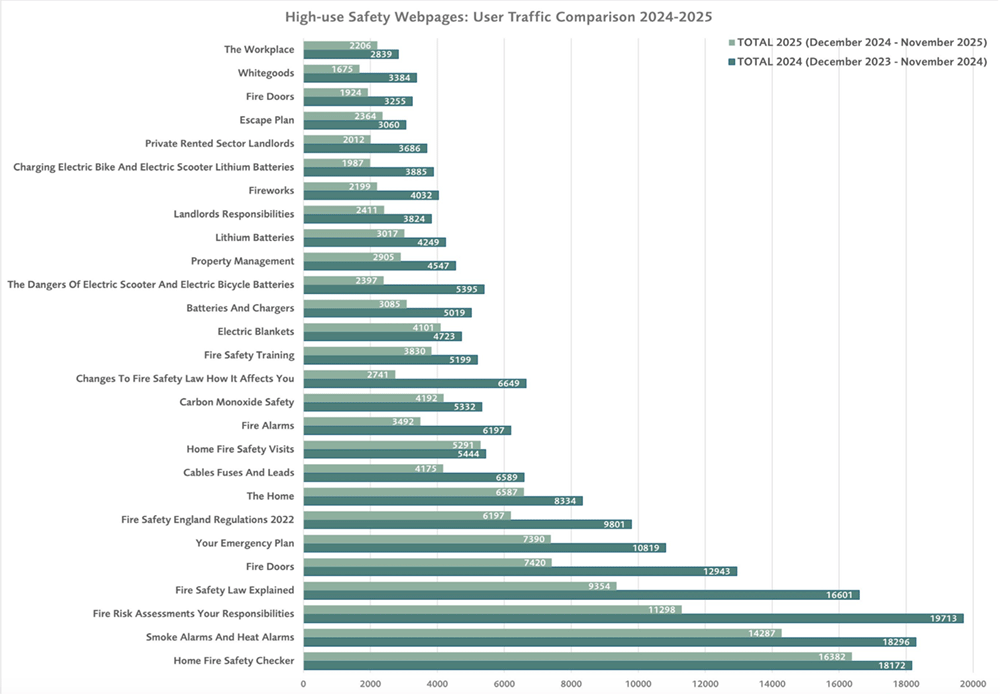
Infographic 5 presents a year‑on‑year comparison of webpage user traffic in 2024 and 2025, focusing on webpages that attracted the highest levels of user traffic. Only webpages with a combined total of 5,000 or more users across both years are included, allowing patterns and changes in high‑demand content to be assessed clearly. The most viewed pages (top 25%), shown in infographic 6, are consistent year-on-year from 2024 to 2025. The six webpages that dominate annual website traffic remain consistently highest across all meteorological seasons indicating persistent higher concern regarding these topics. It should be noted overall engagement with the safety pages as a whole has reduced.
Website traffic indicates that information regarding ‘Smoke and heat alarms’, ‘Fire Risk Assessments: Your Responsibilities’, ‘Fire Safety Law Explained’, ‘Property Management: Fire Doors’ and ‘The Workplace: Your Emergency Plan’ show the highest level of public concern. It could, however, also indicate that these are the subjects that LFB promote more regularly and/or successfully with their target audiences. The subject matter suggests webpage traffic may largely be driven by individuals with legal fire safety responsibilities and/or professional duties, alongside residents seeking assurance that these obligations have been met. While this cannot be confirmed without specific user-level data, the consistency of this trend across years and seasons indicates a strong professional-use bias to LFB safety pages.
The prominence of the ‘Home Fire Safety Checker’ page within the data set is expected as this is a referral pathway into the primary prevention service of LFB. It can be assumed that this page will always see some of the highest traffic due to people receiving a service in return and being directed to this page as the gateway for LFB services by staff and partners.
Six webpages exhibited noticeable seasonal fluctuations (infographic 7). The seasonal fluctuations appear to align with expected behaviours: interest in grass and wildfire safety rising during summer months, accompanied by a modest increase in barbeque related content in 2024. In Autumn, fireworks safety had higher engagement, while Winter sees heightened engagement with topics such as electric blanket safety and carbon monoxide awareness. These fluctuations suggest that user behaviour is influenced by seasonal risk factors, reflecting predictable shifts in safety priorities throughout the year.
Notably safety content regarding Lithium Batteries receives a steady level of user traffic indicating persistent concern; wildfire-related topics appear to be increasing in traffic, perhaps reflecting growing public concern about wildfire risk and suggesting a potential shift from the observed discrepancy between perceived and assessed risk of this hazard. Flooding-related content is attracting low engagement, suggesting that visitors to the LFB website either seek this information from alternative sources or perceive flooding as a lower-priority concern compared to other risks/hazards. This may indicate a gap in public awareness or differing perceptions of risk severity.
Infographic 5. Comparison of annual user traffic on webpages from 2024 to 2025
Infographic 6: Webpages featuring in the top 25% of user traffic across 2024 and 2025
| Grouping | Webpage name |
TOTAL 2024 (Dec 2023 - Nov 2024) |
TOTAL 2025 (Dec 2024 - Nov 2025) |
|
Home or personal safety |
Home Fire Safety Checker |
18172 |
16382 |
|
Home or personal safety |
Smoke Alarms and Heat Alarms |
18296 |
14287 |
|
The Workplace |
Fire Risk Assessments Your Responsibilities |
19713 |
11298 |
|
The Workplace |
Fire Safety Law Explained |
16601 |
9354 |
|
Property Management |
Fire Doors |
12943 |
7420 |
|
The Workplace |
Your Emergency Plan |
10819 |
7390 |
|
Property Management |
Fire Safety England Regulations 2022 |
9801 |
6197 |
|
Home or personal safety |
The Home |
8334 |
6587 |
|
Home or personal safety |
Cables Fuses and Leads |
6589 |
4175 |
|
Home or personal safety |
Home Fire Safety Visits |
5444 |
5291 |
|
Property Management |
Fire Alarms |
6197 |
3492 |
|
Home or personal safety |
Carbon Monoxide Safety |
5332 |
4192 |
|
Property Management |
Changes To Fire Safety Law How It Affects You |
6649 |
2741 |
|
The Workplace |
Fire Safety Training |
5199 |
3830 |
|
Home or personal safety |
Electric Blankets |
4723 |
4101 |
|
Home or personal safety |
Batteries and Chargers |
5019 |
3085 |
|
Lithium Batteries |
The Dangers of Electric Scooter and Electric Bicycle Batteries |
5395 |
2397 |
|
Property Management |
Property Management |
4547 |
2905 |
|
Lithium Batteries |
Lithium Batteries |
4249 |
3017 |
|
Property Management |
Landlords Responsibilities |
3824 |
2411 |
|
Home or personal safety |
Fireworks |
4032 |
2199 |
|
Lithium Batteries |
Charging Electric Bike and Electric Scooter Lithium Batteries |
3885 |
1987 |
|
Property Management |
Private Rented Sector Landlords |
3686 |
2012 |
|
Home or personal safety |
Escape Plan |
3060 |
2364 |
|
Home or personal safety |
Fire Doors |
3255 |
1924 |
|
The Workplace |
The Workplace |
2839 |
2206 |
|
The Workplace |
Automatic Fire Alarms |
2996 |
1949 |
Infographic 7: The top 6 webpages across 2024 and 2025 in comparison to those webpages with dramatic seasonal shifts (made using Flourish).