This layer sets out the risks associated with incidents attended in the last five calendar years by LFB. As such this layer is primarily concerned with risks that occur sufficiently often to be considered “normal requirements”. This is a term used in the Fire and Rescue Services Act 2004 to describe the level of “personnel, services and equipment” that should be provided for firefighting and road traffic accidents. Less frequently occurring events which would cause significant harm or damage outside of normal requirements are considered in layer three.
In this layer incidents can score high on the risk matrices due to the number of resources that were deployed to an incident or because of the casualty rate of a given incident type. By having two metrics for consequence the approach captures incidents that have a relatively low resource draw but a high casualty rate, such as persons trapped in road traffic collisions, and incidents such as fires in rural areas that have a relatively low casualty rate but a high draw on resources. Both incident types present risk to the community of London in their own way.
Risk information is displayed in two separate risk lists below. The different presentations allow the same incident data to be viewed in different ways by different intended users. Risk is presented by location and building type in the first list. This is intended for users where the geography or location of a risk is important, for instance, understanding the distribution of risk between different property types or highlighting risks associated with rural areas. For users where the geography is less important, and it is the specific activity that is relevant, the second list shows incident risk data by the LFB Incident Type Code (ITC). This presentation allows users to focus on incident types that have high casualty rates such as “C3 Acid attack on a person” that are less visible in the location-based data, as they are not constrained by building type or location and may occur anywhere.
The highest risk incident types under normal requirements are;
- A1 Fire
- A1HR Fire High Rise Buildings
- B1 Person trapped excluding RTC
- B1T Train or Tram incident involving trapped person
- B2 reduced special service
- B3 Effecting Entry
- B10 Person in Precarious Position
- B11 Person collapsed / injured including behind doors
- B12 Person Threatening To Jump
- B19 Assist LAS Ambulance with Bariatric/Difficult removal
- C1 Hazmat Incident initial call
- C3 Acid attack on Person
- J3 Person in waterway / on foreshore accessible from land
- J0 FBT Running call from MCA
- Make safe RTC
- Persons trapped RTC
- N0 NILO assessment
- Vehicle fire
Based on incident data from the last 5 years, the risk presented by A1HR incidents has increased, these relate to fires in high rise buildings. This is driven by an increase in the severity score, indicating more casualties. This type of incident is a persistently high risk and is associated with a higher-than-average casualty rate compared to other types of incident .
Incident data indicates a trend of increasing likelihood and increasing severity for incidents related to Persons in Crisis and Person Threatening to Jump. This relates to Incident Types B12, J12 and Special Service Suicide attempts. This is a persistent increase over the data capture period.
The data sources that record cause of fire and items most commonly involved in fire are not presented in this layer. This is intentional. These data are tracked and reported by LFB fire investigation and they are fed into layer four of this assessment where trends of increasing risk and demand are identified. This is why Lithium-ion or e-bike fires do not appear in this layer but are a key finding of layer four.
Although presented independently; there are dependencies and links between layer two and layer four. Trends of increasing likelihood or severity identified in layer two will drive the reporting of concerns regarding trends in horizon one and two of layer four.
Incident risk - data by type and location
Status: Red
Fire - Manufacturing and processing
Fire - Retail
Non-Fire - Boat
Non-Fire - Outdoor water
Non-Fire - Trains
Non-Fire - Vegetation by road, track or canal
Consequence: 5 (on a scale of 1-5 where 5 is the highest option)
Likelihood: 2 (likely frequency of incidents occurring within London - between one a week and one a day)
Fire - House or Bungalow
Fire - Private garage, shed or outbuilding
Non-Fire - Transport buildings
Consequence: 5 (on a scale of 1-5 where 5 is the highest option)
Likelihood: 3 (likely frequency of incidents occurring within London - between one and five a day)
Fire - Converted flats and HMOs
Non-Fire - Rural land
Consequence: 4 (on a scale of 1-5 where 5 is the highest option)
Likelihood: 3 (likely frequency of incidents occurring within London - between one and five a day)
Fire - Purpose built flats
Consequence: 5 (on a scale of 1-5 where 5 is the highest option)
Likelihood: 4 (likely frequency of incidents occurring within London - between five and twenty a day)
Non-Fire - Urban infrastructure
Consequence: 4 (on a scale of 1-5 where 5 is the highest option)
Likelihood: 4 (likely frequency of incidents occurring within London - between five and twenty a day)
Non-Fire - Road Vehicle
Consequence: 5 (on a scale of 1-5 where 5 is the highest option)
Likelihood: 5 (likely frequency of incidents occurring within London - twenty or more a day)
Non-Fire - Converted flats and HMOs
Non-Fire - House or Bungalow
Non-Fire - Purpose built flats
Consequence: 4 (on a scale of 1-5 where 5 is the highest option)
Likelihood: 5 (likely frequency of incidents occurring within London - twenty or more a day)
Status: Amber
Fire - Other residential property
Fire - Warehouses and bulk storage
Non-Fire - Camping tent, shelter or marquee
Consequence: 5 (on a scale of 1-5 where 5 is the highest option)
Likelihood: 1 (likely frequency of incidents occurring within London - between one a year and once a week)
Fire - Care and supported living
Fire - Offices and call centres
Fire - Public administration, utilities and amenities
Fire - Short stay accommodation
Non-Fire - Other residential property
Consequence: 4 (on a scale of 1-5 where 5 is the highest option)
Likelihood: 2 (likely frequency of incidents occurring within London - between one a week and one a day)
Fire - Road Vehicle
Fire - Rural land
Fire - Urban infrastructure
Non-Fire - Communal living
Non-Fire - Entertainment and culture
Non-Fire - Food and Drink
Non-Fire - Hospitals and medical care
Non-Fire - Manufacturing and processing
Non-Fire - Private garage, shed or outbuilding
Non-Fire - Sports and leisure
Non-Fire - Warehouses and bulk storage
Consequence: 3 (on a scale of 1-5 where 5 is the highest option)
Likelihood: 3 (likely frequency of incidents occurring within London - between one and five a day)
Non-Fire - Education
Non-Fire - Offices and call centres
Non-Fire - Retail
Non-Fire - Short stay accommodation
Consequence: 3 (on a scale of 1-5 where 5 is the highest option)
Likelihood: 4 (likely frequency of incidents occurring within London - between five and twenty a day)
Non-Fire - Care and supported living
Consequence: 3 (on a scale of 1-5 where 5 is the highest option)
Likelihood: 5 (likely frequency of incidents occurring within London - twenty or more a day)
Status: Yellow
Non-Fire - Static Caravan, Houseboat, towing caravan
Consequence: 4 (on a scale of 1-5 where 5 is the highest option)
Likelihood: 1 (likely frequency of incidents occurring within London - between one a year and once a week)
Fire - Aircraft
Fire - Boat
Fire - Communal living
Fire - Entertainment and culture
Consequence: 3 (on a scale of 1-5 where 5 is the highest option)
Likelihood: 1 (likely frequency of incidents occurring within London - between one a year and once a week)
Fire - Farming and agriculture
Fire - Food and Drink
Fire - Hospitals and medical care
Fire - Landfill or wasteland
Fire - Other non-residential property
Non-Fire - Car park and transport
Non-Fire - Farming and agriculture
Non-Fire - Other non-residential property
Non-Fire - Urban furnishings
Consequence: 3 (on a scale of 1-5 where 5 is the highest option)
Likelihood: 2 (likely frequency of incidents occurring within London - between one a week and one a day)
Fire - Education
Fire - Transport buildings
Fire - Urban furnishings
Non-Fire - Aircraft
Consequence: 2 (on a scale of 1-5 where 5 is the highest option)
Likelihood: 2 (likely frequency of incidents occurring within London - between one a week and one a day)
Non-Fire - Public administration, utilities and amenities
Consequence: 2 (on a scale of 1-5 where 5 is the highest option)
Likelihood: 3 (likely frequency of incidents occurring within London - between one and five a day)
Fire - Refuse, rubbish or recycling
Consequence: 2 (on a scale of 1-5 where 5 is the highest option)
Likelihood: 4 (likely frequency of incidents occurring within London - between five and twenty a day)
Status: Green
Fire - Barbeque
Fire - Camping tent, shelter or marquee
Fire - Religious
Fire - Sports and leisure
Fire - Static Caravan, Houseboat, towing caravan
Fire - Trains
Consequence: 2 (on a scale of 1-5 where 5 is the highest option)
Likelihood: 1 (likely frequency of incidents occurring within London - between one a year and once a week)
Fire - Car park and transport
Consequence: 1 (on a scale of 1-5 where 5 is the highest option)
Likelihood: 1 (likely frequency of incidents occurring within London - between one a year and once a week)
Fire - Vegetation by road, track or canal
Non-Fire - Barbeque
Non-Fire - False Alarm - Property not found
Non-Fire - Landfill or wasteland
Non-Fire - Religious
Consequence: 1 (on a scale of 1-5 where 5 is the highest option)
Likelihood: 2 (likely frequency of incidents occurring within London - between one a week and one a day)
Non-Fire - Refuse, rubbish or recycling
Consequence: 1 (on a scale of 1-5 where 5 is the highest option)
Likelihood: 3 (likely frequency of incidents occurring within London - between one and five a day)
Incident risk data by Incident Type Code
Status: Red
B10: Person in Precarious Position requiring immediate rescue
B19: Assist Ambulance with Bariatric/Difficult removal of Patient
B1T: Person under Train/Tram or Person Struck by Train/Tram
C3: Acid Attack on Person
G11: NILO Assessment - Nil attendance
J0: FBT Running Call received from MCA
J3: Person/Animal in Waterway/on Foreshore
RTC: Road Traffic Collision
VEHICLE: Vehicle fires - Small/Large & Incidents involving vehicles
Consequence: 5 (on a scale of 1-5 where 5 is the highest option)
Likelihood: 2 (likely frequency of incidents occurring within London - between one a week and one a day)
B1: Person Trapped (Not RTC)
C1: HazMat - including cylinders/refrigerant leaking/Fuel Spill over 100 litres - inside or outside
N0: Nil Attendance
Consequence: 5 (on a scale of 1-5 where 5 is the highest option)
Likelihood: 3 (likely frequency of incidents occurring within London - between one and five a day)
B12: Person Threatening to Jump or Assisting MPS with Persons at Height
Consequence: 4 (on a scale of 1-5 where 5 is the highest option)
Likelihood: 3 (likely frequency of incidents occurring within London - between one and five a day)
A1HR: Fire in High Rise Flats/Commercial Buildings - 6 flrs & above
B11: Person Collapsed or Injured behind locked door when called by LAS or MPS
PERSONS: Persons trapped - RTC
Consequence: 5 (on a scale of 1-5 where 5 is the highest option)
Likelihood: 4 (likely frequency of incidents occurring within London - between five and twenty a day)
B2: Reduced Special Service - including ceiling plaster/trees/roof tiles/bldg fascia/aerials etc in precarious position & person collapsed or injured in street etc.
MAKE: Make safe - RTC
Consequence: 4 (on a scale of 1-5 where 5 is the highest option)
Likelihood: 4 (likely frequency of incidents occurring within London - between five and twenty a day)
A1: Fire - including large vehicle fires
Consequence: 5 (on a scale of 1-5 where 5 is the highest option)
Likelihood: 5 (likely frequency of incidents occurring within London - twenty or more a day)
B3: Effecting Entry - Person Locked Out/In & Person Collapsed Behind Locked Door
Consequence: 4 (on a scale of 1-5 where 5 is the highest option)
Likelihood: 5 (likely frequency of incidents occurring within London - twenty or more a day)
Status: Amber
AMB: Ambulance required for not incident related
B13: Serious Collision involving Brigade vehicle
B14: Minor Collision involving Brigade vehicle
B1B: RTC involving vehicle into building
B7: Train/Tram Crash
B93: Collapse of Building/Structure (Level 3) - Persons involved
D3: Sub Surface incident including tunnels under construction, shafts and sewers
E3: Aircraft Accident/Aircraft Accident Imminent
ES5: Emergency Services Channel
FSG: 1 or more FSG calls in any premise type
FUEL: Fuel Spill on Motorway
G0: Operation PLATO - Nil attendance
J1: Midstream Incident on the Thames
J8: Vehicle in Waterway accessible from land
PERSON: Person on Fire - Out in the open
PI: Person Injured
Consequence: 5 (on a scale of 1-5 where 5 is the highest option)
Likelihood: 1 (likely frequency of incidents occurring within London - between one a year and once a week)
A4: Fire Involving HazMat - including cylinders and explosions
J12: Person Threatening to Jump from Bridge or Structure on the River Thames
MULTI: Multi lane make safe - RTC
Consequence: 4 (on a scale of 1-5 where 5 is the highest option)
Likelihood: 2 (likely frequency of incidents occurring within London - between one a week and one a day)
A8: Fire all Out
Consequence: 3 (on a scale of 1-5 where 5 is the highest option)
Likelihood: 3 (likely frequency of incidents occurring within London - between one and five a day)
C2: Fuel Spill up to 100 litres inside/outside (not RTC)
C5: Natural Gas Leak - commercial or residential
Consequence: 3 (on a scale of 1-5 where 5 is the highest option)
Likelihood: 4 (likely frequency of incidents occurring within London - between five and twenty a day)
A10: AFA Commercial Premises
A11: AFA Residential Premises - for High Rise use A1HR
A2: Reduced Fire Attendance - including electrical junction box
B4: Flooding
Consequence: 3 (on a scale of 1-5 where 5 is the highest option)
Likelihood: 5 (likely frequency of incidents occurring within London - twenty or more a day)
Status: Yellow
B92: Collapse of Bldg/Structure (Level 2) – No persons involved
ROAD: RTC on Motorway
Consequence: 4 (on a scale of 1-5 where 5 is the highest option)
Likelihood: 1 (likely frequency of incidents occurring within London - between one a year and once a week)
C4: Mercury Spill
FIRE: Fire on Motorway
MA: Mutual Assistance
Consequence: 3 (on a scale of 1-5 where 5 is the highest option)
Likelihood: 1 (likely frequency of incidents occurring within London - between one a year and once a week)
A0: Tests / Exercises No attendance
A12: Siege/Person Threatening to set light to themselves or property
A3: Reduced Fire Attendance involving Railway/Tram property
B0: No attendance recommended refer to Supervisor
Consequence: 3 (on a scale of 1-5 where 5 is the highest option)
Likelihood: 2 (likely frequency of incidents occurring within London - between one a week and one a day)
B6: Burst Water Main
E1: Aircraft Full Emergency/Ground Incident
Consequence: 2 (on a scale of 1-5 where 5 is the highest option)
Likelihood: 2 (likely frequency of incidents occurring within London - between one a week and one a day)
Status: Green
A7: Fire on Vessel - accessible by land
AFR: Alleged Fire Risk
C11S: HazMat - British Transport Police Support
CNAT0: Mass Decontamination National Initial Call
D1: Fire in Road/Rail Tunnel
D2: Train Crash in Railway Tunnel
FFEM: Firefighter Emergency - Load new CCF
G6: Op Hasani/Wide Area Search - Nil Attendance
J2: Houseboat/Vessel Sinking/Flooded Accessible from land
J7: Fire on Vessel on Thames
Consequence: 1 (on a scale of 1-5 where 5 is the highest option)
Likelihood: 1 (likely frequency of incidents occurring within London - between one a year and once a week)
AFA: ITC as per SECH flowchart
B8: Commercial Flooding
Consequence: 1 (on a scale of 1-5 where 5 is the highest option)
Likelihood: 2 (likely frequency of incidents occurring within London - between one a week and one a day)
B2E: Person Shut in Lift - Emergency
B2NE: Person Shut in Lift - Non Emergency
Consequence: 1 (on a scale of 1-5 where 5 is the highest option)
Likelihood: 4 (likely frequency of incidents occurring within London - between five and twenty a day)
Layer 2.2. Geographic disposition of risk
The Brigade uses methodology developed by the NFCC to highlight the geographic distribution of indicators for increased risk related to dwelling fires and road traffic collisions (RTC). Dwelling fire risk is calculated using correlation between demographic factors and fire risk to assign a geographical area with a fire risk rating. The approach uses national incident data and is developed by the NFCC. In this document the NFCC methodology using Lower Super Output Areas, (LSOAs) has been selected. This was chosen by LFB as sufficiently granular for understanding the distribution of dwelling fire risk pan-London.
A similar approach is used to map road traffic collision (RTC) risk but using features of the road network to correlate with risk rather than demographic factors. Using the NFCC methodology to identify road traffic collision risk, indicates higher risk in the road network towards the periphery of London and reflects the main routes into the capital. Road fatalities in London often occur more centrally than would be predicted by the NFCC method of assessing road risk. These central areas are areas of high vehicle and vulnerable road user interaction.
The NFCC has developed a methodology for non-dwelling fire risk. LFB is likely to adopt this for subsequent iterations of this assessment.
To aid understanding of demand across all hazards to which the Brigade might respond. LFB has developed an approach illustrative of where demand for services predominantly occurs and where different types of risk proxy are concentrated. We term this approach, Neighbourhood Density Zones. These are broadly concentric zones of similar population density.
In general, there is an increased demand for all our services in areas of higher population and building density and a concentration of public and private infrastructure to be protected. These areas of higher demand are predominantly central. Dwelling fire risk using the NFCC definition of risk methodology indicates a disposition of dwelling fire risk that largely reflects areas of higher density and higher general demand for services. The NFCC dwelling fire risk map, and the map of neighbourhood density zones are therefore similar in appearance. However, each neighbourhood zone has a different risk profile reflective of its level of density. There are some high risks that occur more commonly in less dense zones such as fires involving rural land, particularly at the boundaries of more and less dense areas, (urban rural interface).
Map 1. Combined map Showing Neighbourhood Density zones overlayed with incidents (data collection 2019 -2023).
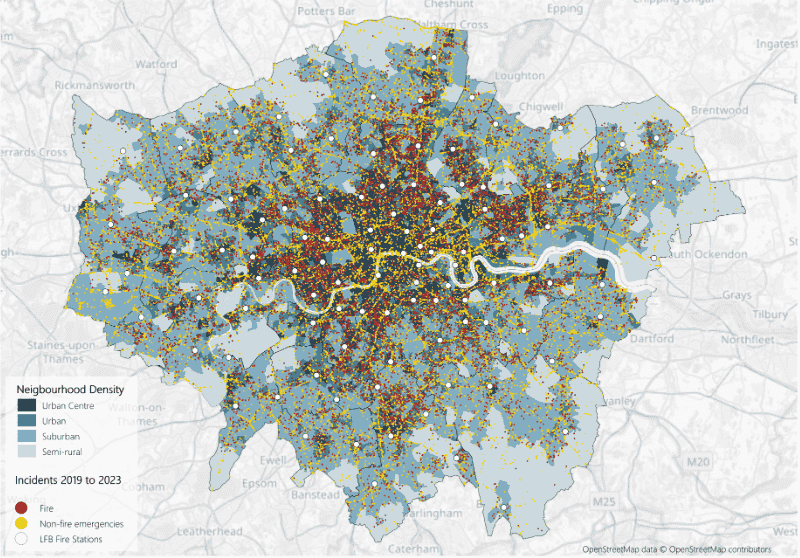
The map above highlights a strong correlation between population density and the frequency of fire and emergency incidents. The greatest number of incidents, both fire and non-fire emergencies, occurred in central and urban areas of London. Incident density decreases in suburban and semi-rural areas toward the outskirts of the map.
Map 2. Dwelling fire risk map of London using NFCC definition of risk for dwelling fires methodology.
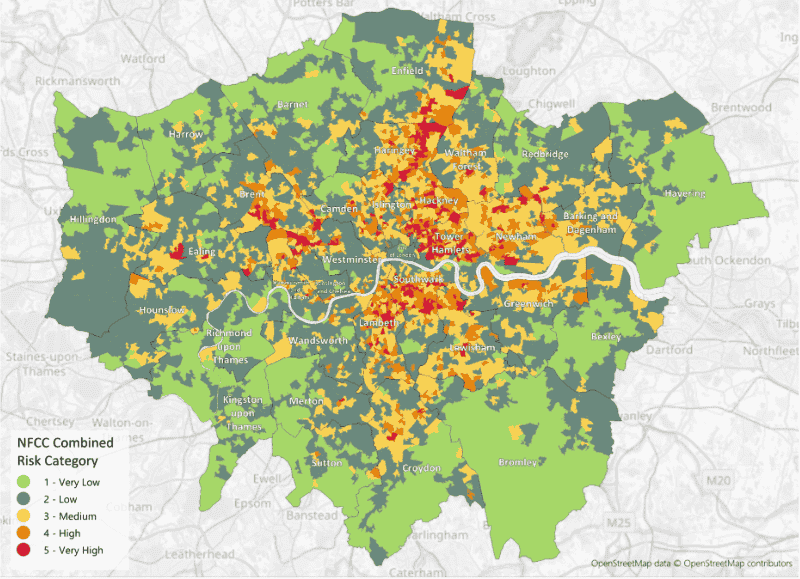
The map above shows central boroughs such as Tower Hamlets, Hackney, Camden, Islington, Westminster, and Southwark having a high concentration of Very High and High risk areas. Outer boroughs such as Havering, Bromley, Richmond upon Thames, and Sutton are predominantly Very Low or Low risk. The highest risk clusters are located in dense urban areas along and near the River Thames. Risk levels generally decrease as you move outward from central London to the suburbs and rural fringes.
Map 3. Road Traffic Collison Risk Map of London using NFCC Definition of risk method.
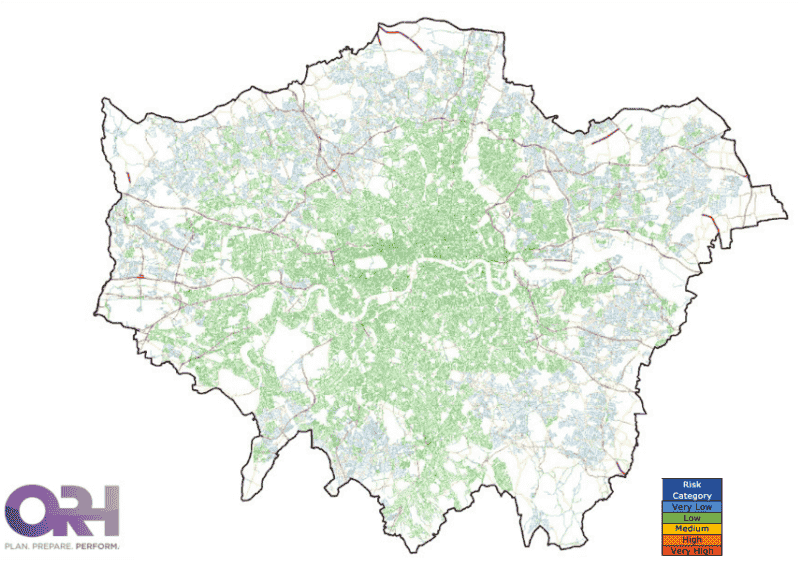
The map above shows a correlation between faster roads on the outskirts of towns, particularly where there are junctions and speed limit changes, and more traffic collisions.