Understanding public concern and risk perception informs effective risk communication and hazard identification. Data on public perception of risk provides both input and output to this assessment.
Input: Hazard Identification
Members of the public may experience risks and threats in their lives at a point earlier in the development of that threat than it appears in LFB incident data as a strong signal. This is because incident data is inherently backwards looking as a planning tool. Members of the public can therefore provide intelligence about threats that they are experiencing day to day, enhancing LFBs understanding of the changing operating environment as it is experienced by the people living in it. Layer one is therefore a part of the Hazard Identification mechanism of this assessment.
Output: Risk Communication
By understanding the primary concerns of members of the public, and the way in which different risks are perceived, the Brigade can make choices about targeting and prioritisation of risk communication work.
Output: Prioritisation
Understanding which risks are perceived as most threatening to the public allows these concerns to be considered and weighed against others when setting organisational priorities, particularly with reference to discretionary or non-statutory work.
By fostering open dialogue and informing professional and public understanding of risk, the Brigade aims to strengthen the relationship between emergency responders and the communities it serves. This report serves as a tool to align the Brigade’s six strategies with the needs and concerns of Londoners, ultimately contributing to a safer and more resilient city. LFB assesses public concerns and public risk perception in three ways:
- Community workshops
- Analysis of website traffic
- YouGov polling
Layer 1.1: Community Workshops
Strategic Planning, as lead department for the AoR, worked in partnership with the Community Engagement Team to plan and facilitate a series of community workshops. The Strategic Planning team provided the overall objectives for the piece of work and technical content. The Engagement team carried out an Equalities Impact Assessment, identifying specific groups for targeted engagement who represented either seldom heard or at-risk groups. The Engagement team facilitated focus groups with the LFB’s Community Forum and organisations/representatives who work with communities (in particular on community risk and resilience). Contact and administration was provided by the LFB Engagement Team. In addition to identified groups an open public workshop was held that any member of the public could attend. Groups within the demographics referenced in the EIA were approached via existing relationships, links made through previous LFB engagement, or contacts provided to the team by colleagues, partners and other organisations. A target number of attendees was not set, as this engagement piece was designed to speak to a number of groups to understand how they might perceive risk, rather than to be a fully representative sample of London. The results of the workshops highlight key underlying concerns that the groups engaged with described. The workshops were also used to judge the level of perceived risk within those groups regarding specified risks identified as of concern by LFB.
Malicious threats and terrorism remained the most concerning risk reported by the public in workshops. Respondents across all groups contacted expressed concern around personal safety and security with 57% of responses falling into this category. Free text responses included a wide range of concerns from the very specific, such as a fear of encountering street violence and knife crime to a general concern regarding community cohesion and intergroup tensions. Terrorism, civil unrest, antisemitism, islamophobia, and racism were all recurring themes in people’s reported concerns. These threats were reported as increasing by groups contacted.
Concerns regarding lithium-ion, e-bikes and e-scooters feature prominently in concerns reported by engaged groups. This indicates that the increasing prevalence of these technologies is concerning for the public and they feel exposed to risk in the daily lives as a result.
Taking account of all responses including extremes, fires in purpose-built flats and fires in high rise residential buildings are second and third most concerning to respondents behind malicious threats, indicating that these are risks to which some respondents feel exposed, or feel are insufficiently controlled. The average perceived risk for car and train collisions and entrapments has increased since last year and the average score exceeds flat and high-rise fires. This higher average may indicate that this is a risk to which many people feel exposed, whereas exposure to fires in flats and high rises buildings is more constrained but heightened for people with exposure through their housing type.
When asked to identify concerns related to underlying causes or drivers of threat in their lives, respondents identified a perception of reduced state capacity leading to a worry about constraints on emergency response from blue light agencies.
Box and Whisker chart 1 shows the level of perceived threat reported by groups engaged centrally by the Community Engagement Team and Strategic Planning. Respondents were asked questions regarding specified risks identified as of concern by LFB. Perceived level of threat varied considerably between individuals and between groups both in terms of specific risks and in the overall level of perceived threat. Data below shows the average of all concern levels for each specified threat in each year the survey has been completed.
The list of public concerns below shows the grouped and aggregated themes from free text responses to the questions:
1. Are there any underlying causes of fire (e.g., smoking, candles, e-bike batteries, etc.) or non-fire emergencies (e.g., mental health, extreme weather, violence, etc.) that you are particularly concerned about?
2. Is there anything not covered by those categories that you are concerned about / think is a risk in your life? This could be anything concerning you, your community, or London that you want to see reflected? using artificial intelligence sentiment analysis tool.
Free text responses collected during all workshops were collated and analysed using an artificial intelligence sentiment analysis tool.
Some additional engagement was delivered through LFB boroughs, using existing contacts and groups identified by Borough Commanders. This is a trial to establish the utility of using Borough Level engagement to extend the reach of public engagement with the LFB assessment of risk. In addition, delivery riders were included as a group in support of the Brigade's ongoing work concerning e-bike safety.
Results achieved from borough workshops indicate similar findings to centrally-led workshops. Malicious Threats and Terrorism along with High-Rise fires and Fires in Flats and Shared Living remain the highest on average among this group, although significant variation was noted between boroughs and individuals. This broad agreement with centrally-led workshops indicates that further role out of borough lead engagement will not reduce data quality in 2026. The introduction of borough workshops increased the number of individuals who provided input to this layer by 70 per cent.
Amongst the specifically targeted group of delivery riders, Malicious Attacks were the most concerning risk. Many expressed fear of knife crime, robbery, and repeated theft of their essential bikes or phones. This is in line with other engaged groups who report perceived increasing crime and violence and fear of attacks against the person.
The relative level of concern and perceived risk list below shows the relative level of concern and perceived risk across the borough workshops and delivery riders. The list of public concerns below presents public concerns that were grouped and aggregated from free text responses collected during borough and delivery rider workshops.
Summary Chart 1. Public Concerns: Grouped and aggregated from free text responses. (Community Engagement Team Workshops)
Concern: Emergency Services Capacity
Description: Cuts in fire, police, and ambulance services. Slow response times, lack of resources, vulnerability to large-scale emergencies, and delayed maintenance checks.
Frequency of concern: High
Concern: E-Bikes, E-Scooters, Lithium Batteries
Description: Concerns about battery fires, improper charging, unsafe storage, use on public transport, and risks of faulty equipment.
Frequency of concern: High
Concern: Violence & Anti-Social Behaviour
Description: Knife crime, stabbings, gang violence, arson, malicious intent, acid attacks, drug-related violence, and threats from far-right groups.
Frequency of concern: High
Concern: Climate Change & Extreme Weather
Description: Concerns about future societal breakdown, storms, heatwaves, flooding, and damage from extreme weather.
Frequency of concern: Moderate
Concern: Phone Theft & Personal Safety
Description: Phone thefts, loss of contact with emergency services, personal safety, and vulnerability in public spaces.
Frequency of concern: Moderate
Concern: Building Safety & Fire Risks
Description: Cladding concerns (post-Grenfell), overcrowded flats, HMO safety, faulty wiring, poorly fitted electrics, and lack of escape routes.
Frequency of concern: High
Concern: Mental Health & Vulnerability
Description: Vulnerable people left in unsafe conditions, arson related to mental health issues, neglect in community settings, and elderly population risks.
Frequency of concern: High
Concern: Candles, Smoking & Open Flames
Description: Risks from open flames, smoking, unsafe use of candles (religious or otherwise), and forgotten items like hair straighteners.
Frequency of concern: Moderate
Concern: Cyber Threats
Description: Concerns about cyber-attacks, digital exclusion, and the vulnerability of digital systems in emergencies.
Frequency of concern: Low
Concern: Lack of Fire Safety Knowledge
Description: Insufficient fire safety education, poor training in shared accommodations, and lack of understanding in vulnerable communities.
Frequency of concern: Moderate
Concern: Fireworks & Anti-Social Behavior
Description: Concerns about fireworks, illegal activity, and arson-related risks, often linked to public disorder.
Frequency of concern: Low
Concern: Unsafe Housing & Rogue Landlords
Description: Issues with sub-standard private rentals, lack of fire checks, overcrowding, and unsafe living conditions.
Frequency of concern: Moderate
Concern: Terrorism & Security Threats
Description: Threats from international unrest, CT-related incidents, bomb threats, marauding terrorist attacks, and vehicle-as-a-weapon threats.
Frequency of concern: High
Concern: Arson & Vandalism
Description: Concern about intentional fires, targeted arson, and destruction of property, including insurance fraud.
Frequency of concern: Moderate
Concern: NHS & Care System Capacity
Description: Increased pressure on palliative care at home, vulnerability of elderly populations, and lack of emergency support for frail individuals.
Frequency of concern: Moderate
Concern: Infrastructure & Public Space Safety
Description: Poor crowd control, overcrowding in public spaces, and inadequate exit routes during emergencies.
Frequency of concern: Low
Concern: Road Safety & Transport Risks
Description: Silent e-bikes and scooters, reckless riding on pavements, and dangers of motorbikes parked dangerously.
Frequency of concern: Low
Concern: Defense & National Security
Description: Concern about depleted defense resources and inability to respond to large-scale attacks.
Frequency of concern: Low
Box and Whisker Chart 1. Perceived threat by risk type and distribution of responses (Community Engagement Team Workshops).
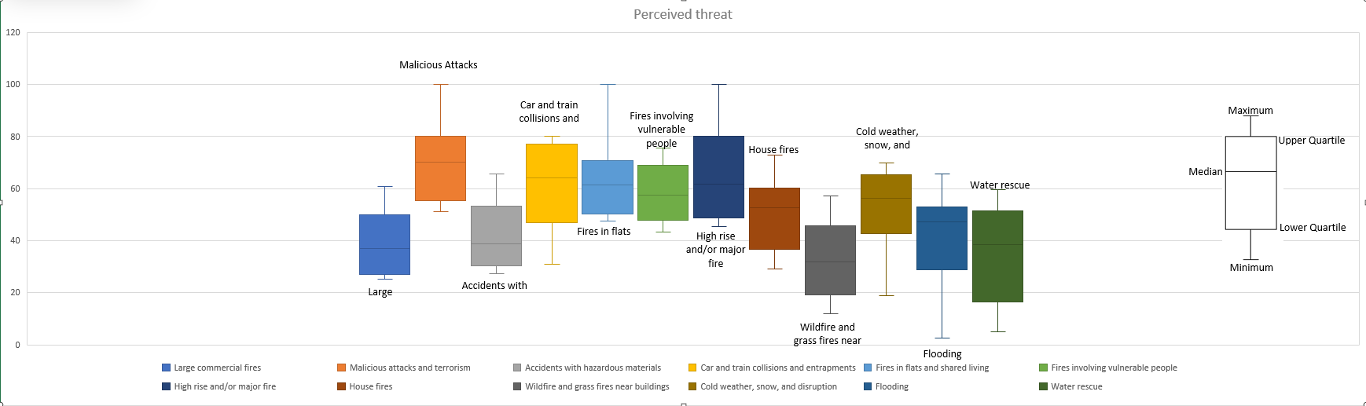
The chart above shows data gathered from Community Engagement Team workshops. It shows that malicious attacks and terrorism were perceived as the highest threat overall. High rise fires, fires in flats, and incidents involving vulnerable people also scored high on perceived threat. Wildfires near buildings, water rescue, and flooding tended to be perceived as lower threats, though still variable. Some categories, such as car and train collisions, showed a wide range in perceived threat, indicating differing levels of concern among participants.
Average of all concern levels for specified threat in each year the survey has been completed (data gathered from Community Engagement Team Workshops).
Average level of perceived threat or risk in "your life" across all engaged groups (out of 100)
Average of Large commercial fires
2025: 37.09
2024: 42.15
Average of Malicious attacks and terrorism
2025: 67.84
2024: 67.99
Average of Accidents with hazardous materials
2025: 40.80
2024: 41.44
Average of Car and train collisions and entrapments
2025: 62.70
2024: 49.40
Average of Fires in flats and shared living
2025: 60.18
2024: 62.18
Average of Fires involving vulnerable people
2025: 58.24
2024: 65.22
Average of High rise and/or major fire
2025: 62.01
2024: 64.55
Average of House fires
2025: 53.15
2024: 55.39
Average of Wildfire and grass fires near buildings
2025: 34.71
2024: 40.76
Average of Cold weather, snow, and disruption
2025: 52.88
2024: 47.34
Average of Flooding
2025: 46.83
2024: 54.47
Average of Water rescue
2025: 42.64
2024: 36.53
Public Concerns: Grouped and aggregated from free text responses. (Borough Workshops and Delivery Riders)
Concern Category: E-Bikes, Scooters & Lithium Batteries
Description: Battery fires, unsafe storage, blocking exits, charging risks, increased collisions.
Estimated Proportion (%): 28%
Concern Category: Mental Health & Vulnerability
Description: Fire risks from individuals with mental illness, hoarding, alcohol dependence, social isolation.
Estimated Proportion (%): 20%
Concern Category: Smoking, Candles & Open Flames
Description: Frequent mentions of open flames (candles, smoking) and their fire risks.
Estimated Proportion (%): 18%
Concern Category: Fire Safety Equipment & Negligence
Description: Lack of smoke/carbon monoxide alarms, expired equipment, no fire extinguishers, general neglect.
Estimated Proportion (%): 8%
Concern Category: Climate Change & Extreme Weather
Description: Flooding, heatwaves, wildfires, global warming-related risks.
Estimated Proportion (%): 6%
Concern Category: Violence & Anti-Social Behaviour
Description: Knife crime, teen gang violence, acid attacks, arson.
Estimated Proportion (%): 5%
Concern Category: Unsafe Heating & Appliances
Description: Portable heaters, cookers, irons, faulty electrics, overheating chargers.
Estimated Proportion (%): 5%
Concern Category: Building Safety & Overcrowding
Description: Unsafe high-rises, cladding, blocked exits, overcrowded HMOs.
Estimated Proportion (%): 4%
Concern Category: Emergency Services & NHS Capacity
Description: Delays in response, ambulance shortages, lack of coordinated emergency planning.
Estimated Proportion (%): 3%
Concern Category: Technology Risks (e.g., Vape Pens, Chargers)
Description: Concerns about small tech (phones, vape pens, chargers) causing fire.
Estimated Proportion (%): 2%
Concern Category: Infrastructure, Planning, Overpopulation
Description: Planning issues, overbuilding, blocked roads, poor local response infrastructure.
Estimated Proportion (%): 1%
Relative level of concern and perceived risk: borough workshops and delivery riders
Perceived risk: Borough Groups and Delivery Riders. Score is out of 100.
Average of Malicious attacks and terrorism:
- Delivery riders: 69
- Ealing : 56
- Hillingdon: 59
- Islington: 50
- Lambeth: 100
- Lewisham: 47
Average of Accidents with hazardous materials:
- Delivery riders: 29
- Ealing: 32
- Hillingdon: 52
- Islington: 32
- Lambeth: 64
- Lewisham: 23
Average of Car and train collisions and entrapments:
- Delivery riders: 32
- Ealing: 45
- Hillingdon: 63
- Islington: 41
- Lambeth: 100
- Lewisham: 47
Average of Cold weather, snow and disruption:
- Delivery riders: 56
- Ealing: 35
- Hillingdon: 52
- Islington: 34
- Lambeth: 93
- Lewisham:67
Average of Flooding:
- Delivery riders: 30
- Ealing: 41
- Hillingdon: 59
- Islington: 37
- Lambeth: 73
- Lewisham: 40
Average of Water rescue:
- Delivery riders: 61
- Ealing: 36
- Hillingdon: 55
- Islington: 23
- Lambeth: 63
- Lewisham: 36
Average of Wildfire and grass fires near buildings:
- Delivery riders: 23
- Ealing: 39
- Hillingdon: 51
- Islington: 27
- Lambeth: 54
- Lewisham: 42
Average of House fires:
- Delivery riders: 42
- Ealing: 55
- Hillingdon: 58
- Islington: 39
- Lambeth: 98
- Lewisham: 53
Average of Fires involving vulnerable people:
- Delivery riders: 43
- Ealing: 53
- Hillingdon: 71
- Islington: 62
- Lambeth: 100
- Lewisham: 39
Average of High rise and/or major fire:
- Delivery riders: 57
- Ealing: 60
- Hillingdon: 61
- Islington: 59
- Lambeth: 97
- Lewisham: 40
Average of Fires in flats and shared living:
- Delivery riders: 58
- Ealing: 58
- Hillingdon: 66
- Islington: 58
- Lambeth: 95
- Lewisham: 45
Average of Large commercial fires:
- Delivery riders: 27
- Ealing: 36
- Hillingdon: 61
- Islington: 41
- Lambeth: 47
- Lewisham: 34
Layer 1.2: Website Traffic Analysis
Analysis of 12 months’ of LFB website traffic was used to indicate level of public concern regarding specific risk information. Data was collected on individual users and the areas of the website that they interacted with within the safety section. An assumption was made that a higher proportion of users viewing a particular type of risk information indicated a higher level of public concern regarding that topic.
Website traffic indicates a proportionally higher level of public concern regarding electrical safety and fires involving lithium-ion, e-bike, e-scooters and batteries and chargers than around other types of fire or emergency. The proportionally high number of users seeking information regarding fires involving e-bikes and e-scooters indicates that within the community this is a large concern, and that people feel exposed to this risk in the short term. This is reflective of results found in workshop data.
Safety information regarding grass and wildfires and regarding water safety and flooding are accessed proportionally less than other topics. This indicates that those choosing to access safety information through the LFB webpage feel less concerned by, or exposed to, these risks or choose to access desired information from other sources. These risks are associated with an upward trend in likelihood and severity due to projected climate change however public concern regarding these is relatively low compared to more immediate risks.
The data below shows the proportions of user visits to different risk information on the LFB safety web page.
Proportions of user visits to different risk information on the LFB safety web pages
- Electrical Items
- Cables, fuses and leads, 6418 users (9.7%)
- Batteries and chargers, 4871 users (7.3%)
- Electric blankets, 4385 users (6.6%)
- White goods, 3328 users (5%)
- How to check if your tumble dryer is a fire risk, 2243 users (3.4%)
- Lithium batteries
- The dangers of electric scooter and electric bicycle batteries, 5007 users (7.5%)
- Charging electric bike and electric scooter lithium batteries, 3614 users (5.4%)
- Electric scooter and electric bike batteries spotting the risks, 2382 users (3.6%)
- E-scooters and e-bikes, 2075 users (3.1%)
- E-bike and e-scooters guidances for responsible persons, 2193 users (3.3%)
- Sofia’s story, 1633 users (2.5%)
- Electric bicycle conversion kits, 635 users (1%)
- Charge safe guidance for responsible people, 453 users (0.7%)
- Carbon monoxide safety, 5345 users (8%)
- Fireworks, 4089 users (6.1%)
- BBQs, 1797 users (2.7%)
- Pan fires, 723 users (1.1%)
- Deep fat fryers, 624 users (0.9%)
- Bonfires, 869 users (1.3%)
- Vulnerable individuals
- Hoarding disorder, 1461 users (2.2%)
- Ability to respond and escape, 825 users (1.2%)
- Emollient and skin creams, 1413 users (2.1%)
- Specialist health equipment, 768 users (1.2%)
- General home safety
- Portable heaters, gas fires and open fires, 1796 users (2.7%)
- Candles, 1252 users (1.9%)
- Smoking
- Vaping and e-cigarettes, 1365 users (2.1%)
- Caring for smokers, 747 users (1.1%)
- Arson
- Reducing arson with letterbox protection, 1109 users (1.7%)
- Reducing arson risk, 964 users (1.5%)
- Motorbike safety course Biker Down, 821 users (1.2%)
- Flooding advice, 371 users (0.6%)
- Water safety, 612 users (0.9%)
- Grass and wildfires, 311 users (0.5%)
Layer 1.3: Polling data
LFB used polling data from YouGov to broaden the reach of the engagement and to achieve as more representative spread of respondents. Respond asked the following question;
“Thinking about potential risks within your local community (e.g. fires, adverse weather conditions, natural events etc.) Which ONE, if any, of the following are you MOST concerned about within your local community”
Results show that, malicious attacks and terrorism, fires in flats and shared living and high rise/and or major fires remain the most concerning risks to respondents. This has remained consistent since 2024’s assessment and across the three polls taken over a period of 18 months.
Water rescue remains consistently the least concerning risk to the public. Similarly low levels of concern are reported for flooding risks; the proportion of people primarily concerned with this risk has fallen consistently in each poll.
Similar to workshop data and website traffic analysis, respondents to polls report concerns regarding risks that are primarily of individual exposure such as dwelling fires, electrical fires and malicious acts and violence.
Thinking about potential risks within your local community (e.g. fires, adverse weather conditions, natural events etc.) Which ONE, if any, of the following are you MOST concerned about within your local community.
Large commercial fires (e.g. fires in shops, warehouses, offices etc)
- March 2024: 2%
- August 2024: 2%
- March 2025: 4%
Fires in flats and shared living (e.g. fires in flat shares)
- March 2024: 19%
- August 2024: 12%
- March 2025: 14%
High rise and/or major fire (e.g. fires like the Grenfell Tower Fire)
- March 2024: 10%
- August 2024: 7%
- March 2025: 14%
Fires involving vulnerable people (e.g. fires in a care home)
- March 2024: 3%
- August 2024: 2%
- March 2025: 6%
House fire (e.g. fires in a standard detached home)
- March 2024: 9%
- August 2024: 7%
- March 2025: 9%
Wildfire and grass fires near buildings (e.g. fires in parkland near houses)
- March 2024: 3%
- August 2024: 3%
- March 2025: 4%
Water rescue (e.g. people fallen into water)
- March 2024: 1%
- August 2024: 1%
- March 2025: 1%
Flooding (e.g. flooding of streets and property after heavy rain)
- March 2024: 8%
- August 2024: 6%
- March 2025: 5%
Cold weather, snow and disruption (e.g. Roads blocked by snow)
- March 2024: 6%
- August 2024: 7%
- March 2025: 5%
Car and train collisions and entrapments
- March 2024: 5%
- August 2024: 4%
- March 2025: 4%
Accidents with hazardous materials (e.g. spills of chemicals from a tanker)
- March 2024: 1%
- August 2024: 3%
- March 2025: 3%
Malicious attacks and terrorism (e.g. the attack of London Bridge or on 7/7)
- March 2024: 11%
- August 2024: 13%
- March 2025: 10%
Layer 1.4: Commentary
Perceived level of threat varied considerably between individuals and between groups both in terms of specific risks and in the overall level of perceived threat. Overall, the highest perceived threat in people’s lives related to malicious attacks and terrorism, fires in flats and shared living and fires in high rise buildings. In addition, public concern was identified as increased around lithium-ion fires, particularly those involving e-bikes and e-scooters. It is noted that many respondents reported of threat in their lives from a perception of increasing violence in their communities, particularly related to knife crime. Risk perception, as measured in this engagement activity, reflects a tendency to focus on risks that have proximity to individuals and to which they feel more exposed. The broad themes of risk related to dwelling fires, malicious acts and concerns regarding e-bikes and scooters were consistent across each method of public concern data collection, indicating a level of assurance that LFB are capturing public sentiment around risk.
Although climate change was reported as an underlying driver of risk in people’s lives by some respondents, the threat of wildfires and flooding in this assessment were some of the least concerning to the public. This may reflect the fact that wildfires or grass fires and flooding are seasonal and generally localised. This may mean that fewer people feel geographically exposed than to these than other risks, or that the proximity effect of the risk has been reduced by the recent moderate summers where wildfires were fewer and severe flooding was not experienced. Communicating the long-term trends towards warmer wetter winters and hotter dryer summers, and the consequent increasing risk of wildfire and flooding may present a challenge to LFB when individual seasons do not follow the long-term trend, and the public do not feel individually exposed.
Risks related to water rescue were some of the least threatening to the public. This contrasts with the high casualty rate of water incidents and the number of fatalities that occur when people enter the water in London. The discrepancy between the perceived and measured risk posed by open water and particularly the Thames among London’s communities indicates a priority for risk communication and engagement work.
These findings support personalised or localised risk communication techniques and suggest that London-wide risk communication tools may be of limited effectiveness at influencing behaviour unless exposure to a given threat is widespread. Strategies for risk communication should be informed by the overall threat environment perceived by communities and the individual challenges faced by different groups, i.e. the threat of street violence is of a high concern to the public and any engagement around perceived risk should be expected to reflect this. The LFB Prepare strategy outlines the Brigade’s approach to helping communities prepare themselves for when threats are realised. The strategy also outlines the partnership approach taken by LFB to addressing wider community threats beyond core statutory functions of LFB. This strategy may be the best vehicle for engaging communities with longer term climate driven risks.
Engagement with fire crews undertaken after the public workshops revealed several examples of crews intervening in violent incidents when moving around London. Crews also reported increasing exposure to violence in day-to-day work. This finding supports the increasing perceived threat level reported by the public.